JLGutierrez
By Jack Janasiewicz, CFA® – Garrett Melson, CFA®
The US Inflation Tracker captures the trends that provide context in today’s economy. There may be some relief in sight as inflation continues to slow.
Inflation’s Last Mile Not So “Sticky” After All?
The Federal Reserve Bank of Atlanta publishes a data series that divides the 45 categories in the CPI basket into “sticky-price” and “flexible-price” aggregates. Sticky prices are defined as line items that exhibit price changes that occur less often, on average, than every 4.3 months. Goods that change prices more frequently are considered flexible-price goods.
Roughly half of the items defined as flexible-price goods comprise food and energy, with the remainder largely autos, apparel, and lodging away from home. Sticky-price CPI includes many service-based categories such as medical services, education, and personal care services, as well as most of the housing categories.
One of the key debates surrounding inflation is the idea of that last mile – getting core inflation to move from a 4% handle down to the 2% target. Inflation hawks argue that this last mile will prove to be a challenge, as inflation will remain sticky. Enter the Atlanta Fed’s Sticky Price CPI series. As we’ve discussed previously, there are a range of methodological quirks and lagged effects related to shelter within the CPI basket. For this reason, stripping out the impact of shelter on current CPI levels provides a better look at the current state of inflation.
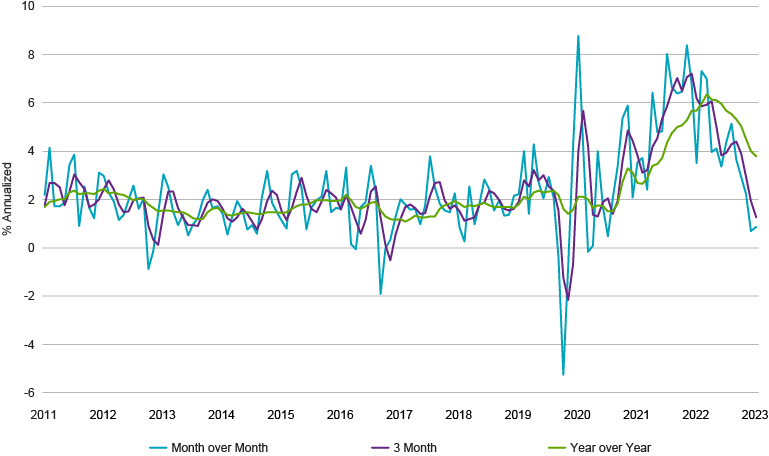
So where does sticky-price inflation ex-shelter stand today? Using our preferred metric of annualizing the 3-month change (which avoids base effects from 12 months ago), this data point shows an annualized rate of 1.25%, comfortably below the Fed’s 2% target. Maybe that last mile won’t prove to be so sticky after all.
Atlanta Fed’s Sticky ex-Shelter Consumer Price Index (12/31/10–7/31/23)

Source: Natixis Investment Managers Solutions, Bloomberg
The Fed’s Implied Terminal Rate
We’ve noted the move in the yield curve that has seen a bear steepener take place – the yield curve widening as long-term rates increase at a faster pace than short-term rates. When decomposing the move more recently, we see that nominal yields have been pushed higher largely by the move in real rates. Inflation expectations have played a minimal role and much of that impact can be attributed to the jump higher in oil prices.
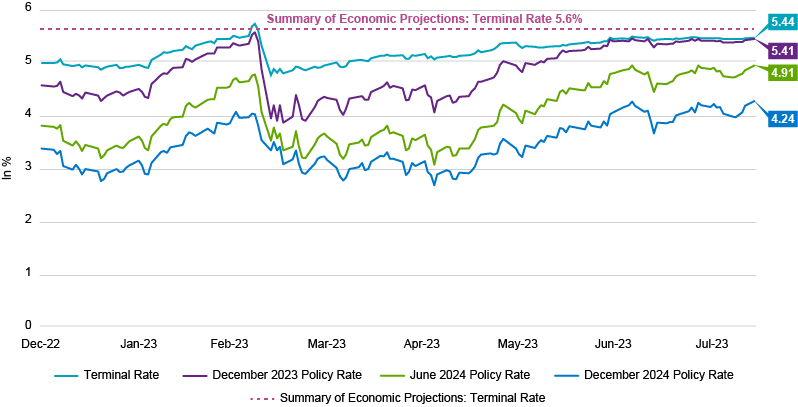
We typically associate a move like this with stronger growth prospects, one that we have highlighted with our views that the 2022 headwinds would turn into 2023 tailwinds. But despite the bear steepener, Fed rate hike expectations have remained basically unchanged. The only difference of note – rate cuts expected in 2024 have slowly been fading.
There is certainly a case to be made for the Fed to pause its hikes in the next few meetings, with possibly one more hike before year-end. Regardless, the market appears to have fully discounted the terminal rate. The disinflation/deflation trends we are currently seeing likely put a ceiling in for rates while the still-resilient growth backdrop probably builds in a floor.
The Market’s Implied Federal Reserve Target Rate: SOFR Curve (12/31/14–8/14/23)

Source: Natixis Investment Managers Solutions, Bloomberg; SOFR (Secured Overnight Financing Rate) measures the cost of borrowing cash overnight collateralized by Treasury securities.
Credit: Source link


