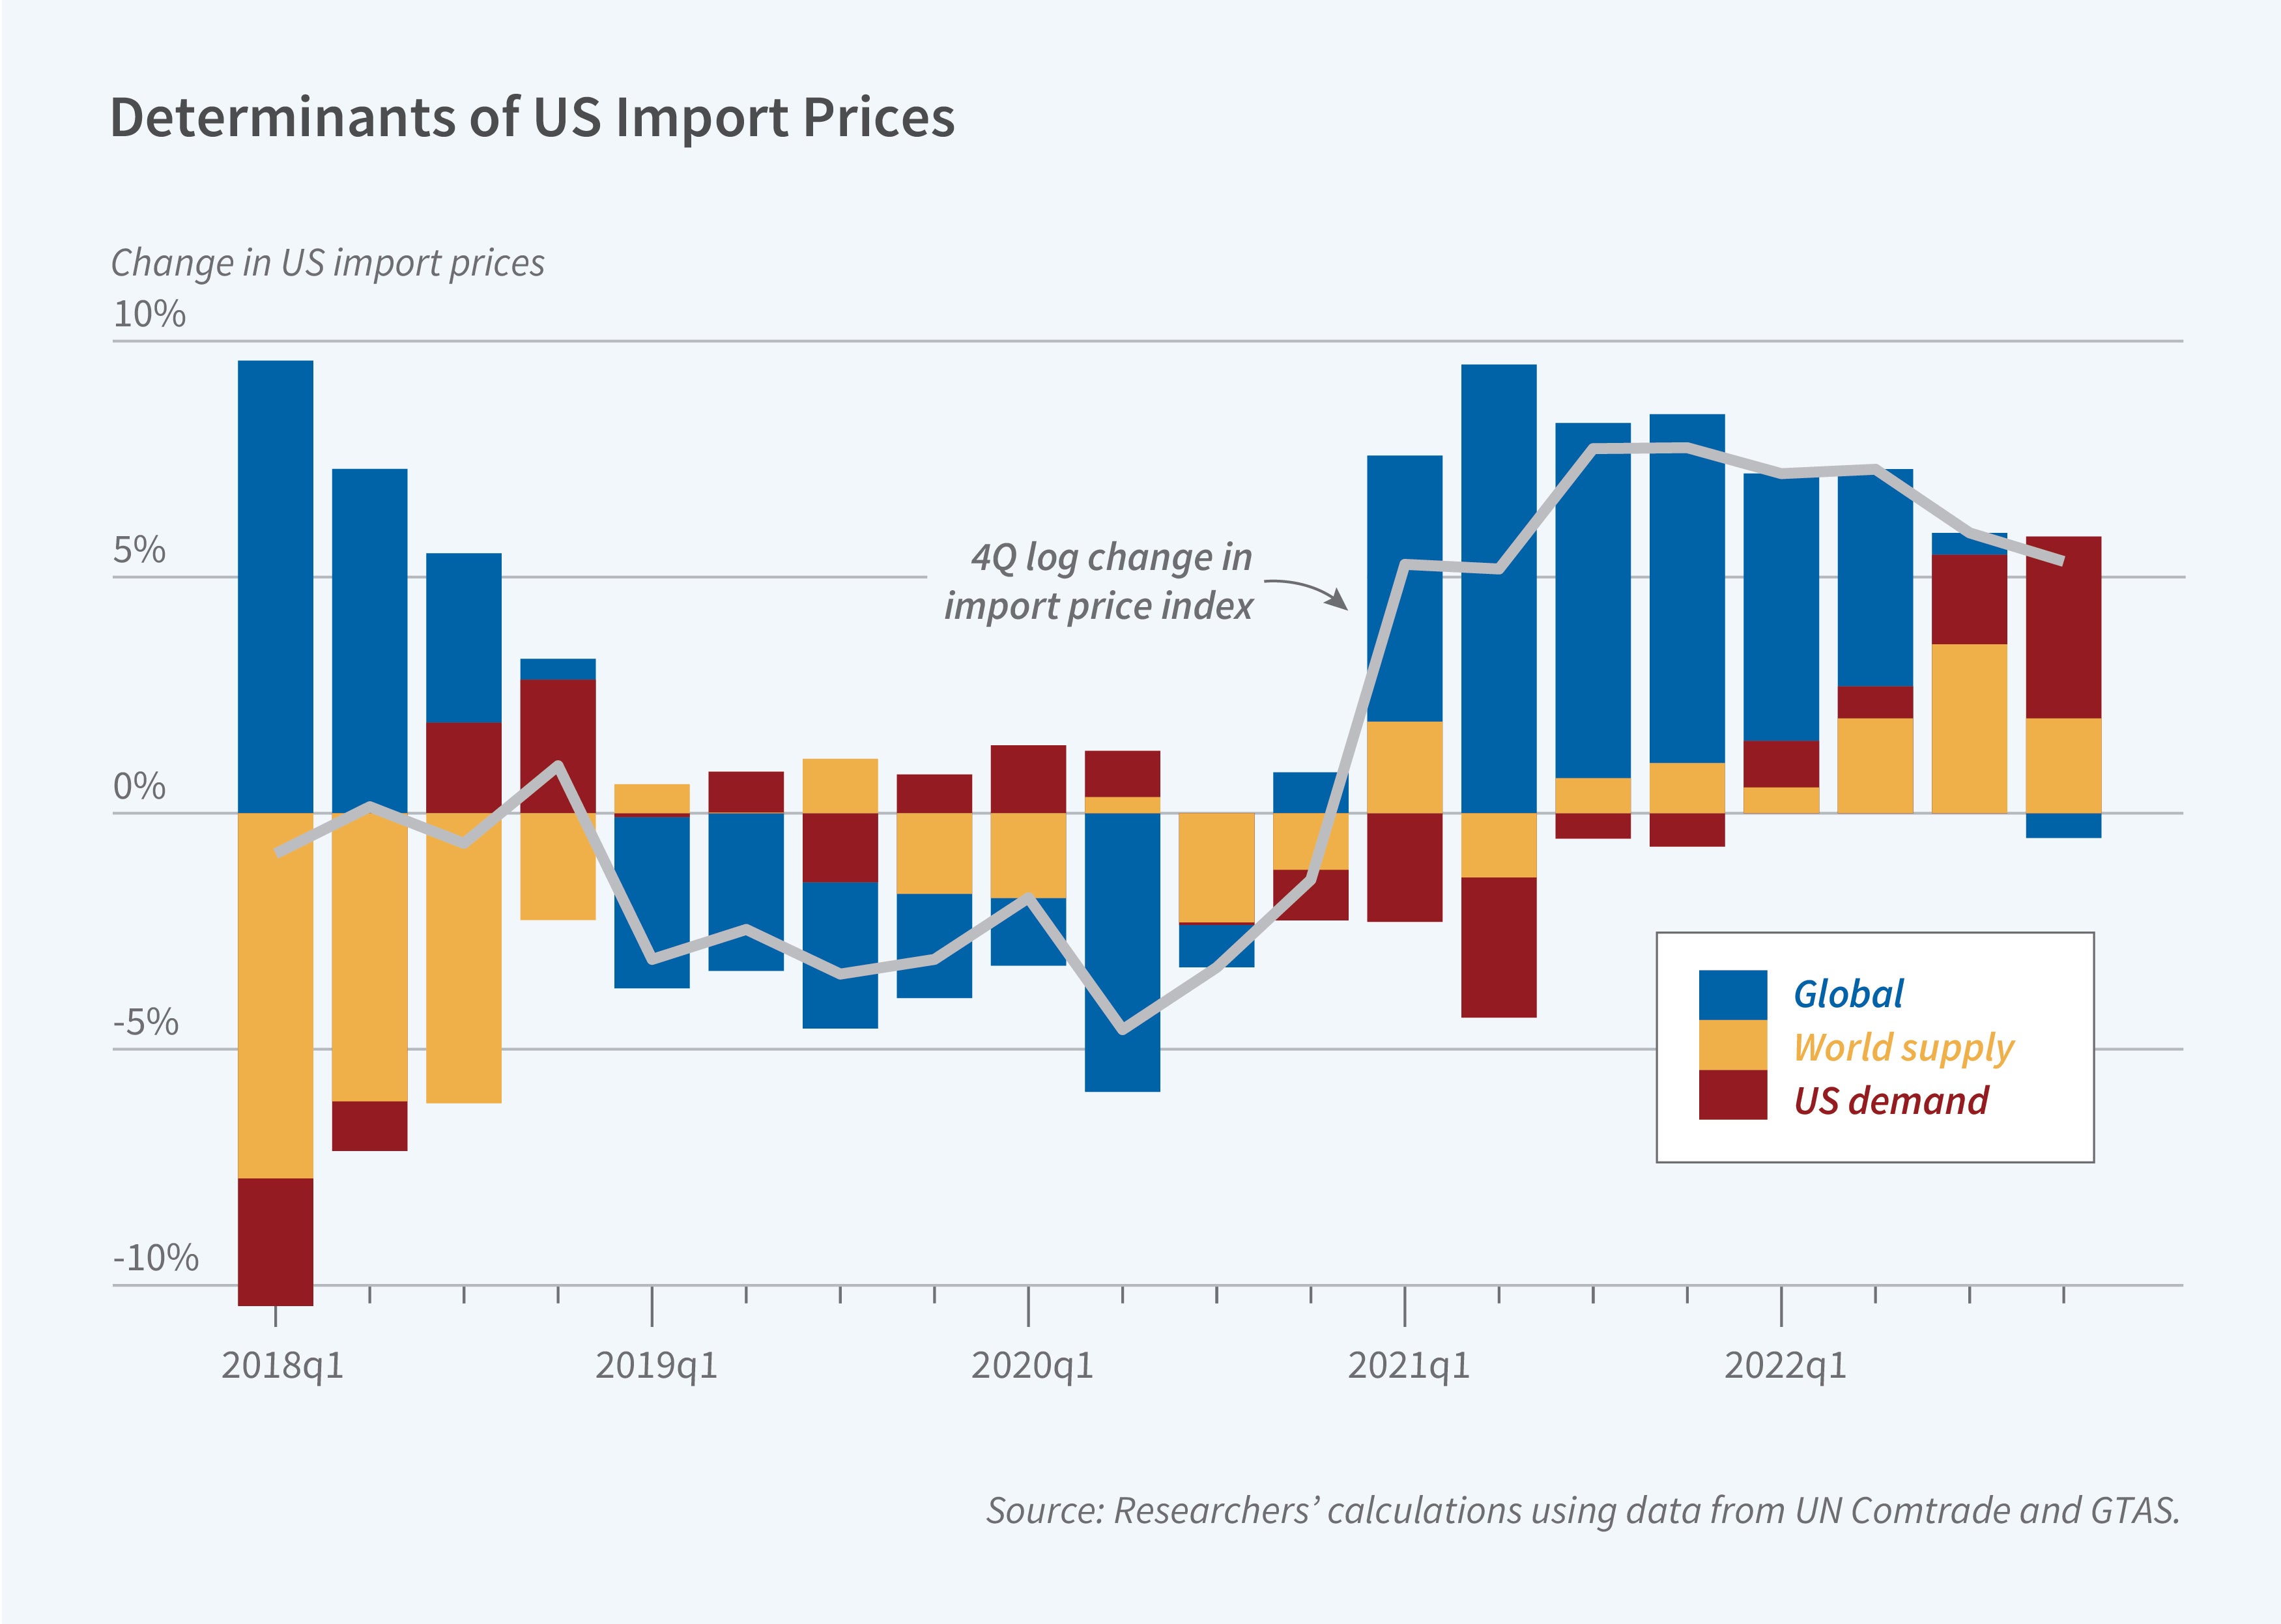
Increases in the prices of imported goods contributed to the overall rise in the US inflation rate during the COVID-19 pandemic. Mary Amiti, Oleg Itskhoki, and David Weinstein investigate the source of import price inflation, distinguishing global shocks from US-specific demand increases, in What Drives US Import Price Inflation? (NBER Working Paper 32133).
The researchers find that US import price inflation tracked worldwide trends from early 2020 until the middle of 2022. US import inflation peaked at 8.1 percent in the second quarter of 2021, when the global component of US imported goods inflation was 7.8 percent. US import inflation remained high for longer than the world average, plateauing at just over 5 percent by the fourth quarter of 2022, when the contribution of the global component of US import inflation was close to zero. This was due to US-specific demand shocks and some supply shocks in specific high-volume exporting countries.
The inflation rate for US imports rose during the pandemic and remained elevated longer than the global average due to US-specific demand shocks.
The researchers analyze UN Comtrade data, in particular the monthly 6-digit Harmonized System (HS) bilateral trade data for 52 countries for 2017–23. The countries include the top 50 exporters to the US in 2017 and all EU member states, accounting for over 92 percent of total US import value. Data from S&P Global or Global Trade Analytics Suite (GTAS) were used to supplement missing data points where possible.
The researchers calculate year-on-year changes in the prices of goods in each industry for each trade route — exporting country to importing country — each quarter. Regressing bilateral import growth in each industry on exporter and importer fixed effects enables them to decompose the growth in trade into import demand and export supply shocks. They define the global price trend component as the median of the exporter and importer effects and the quarter-specific demand and supply shocks as the weighted sum of the fixed effects coefficients for individual exporter or importer countries. This procedure isolates shocks for each product specific to a given exporter or importer, such as Chinese semiconductor exports or US imports of semiconductors.
When the researchers disaggregated their analysis to focus on the type of good traded, they found that for US imports, inflation for fuel, food, and industrial supplies closely tracked global price trends. Capital goods prices were affected primarily by idiosyncratic world supply shocks, while consumer goods prices were mainly affected by idiosyncratic US demand shocks. At the end of 2022, goods that were notably affected by US-specific demand shocks included LED displays, mobile phones, pharmaceuticals, video games, diamonds, lighting, and motorcycles. In contrast, those affected by country-specific supply shocks included data processing machines, LED and electric machines, communication apparatus from China, Hong Kong, Korea, Mexico, and Thailand, and air conditioners from Mexico. The researchers suggest that many of these supply shocks may be linked to shortages of semiconductors, a key input.
— Emma Salomon
Credit: Source link


