Stocks rallied last week, with the S&P 500 climbing 1.3% to close at 4,415.24. The index is now up 15% year to date, up 23.4% from its October 12, 2022 closing low of 3,577.03, and down 7.9% from its January 3, 2022 record closing high of 4,796.56.
While the overall data indicate continued economic growth, there are signs of stress developing that bear watching.
According to the New York Fed’s Q3 Household Debt and Credit (HHDC) report, the share of debt newly transitioning into delinquency continues to rise for mortgages, auto loans, and credit cards.
When you include the debt, the delinquency rates, while rising, continue to reflect a normalization back to prepandemic levels.
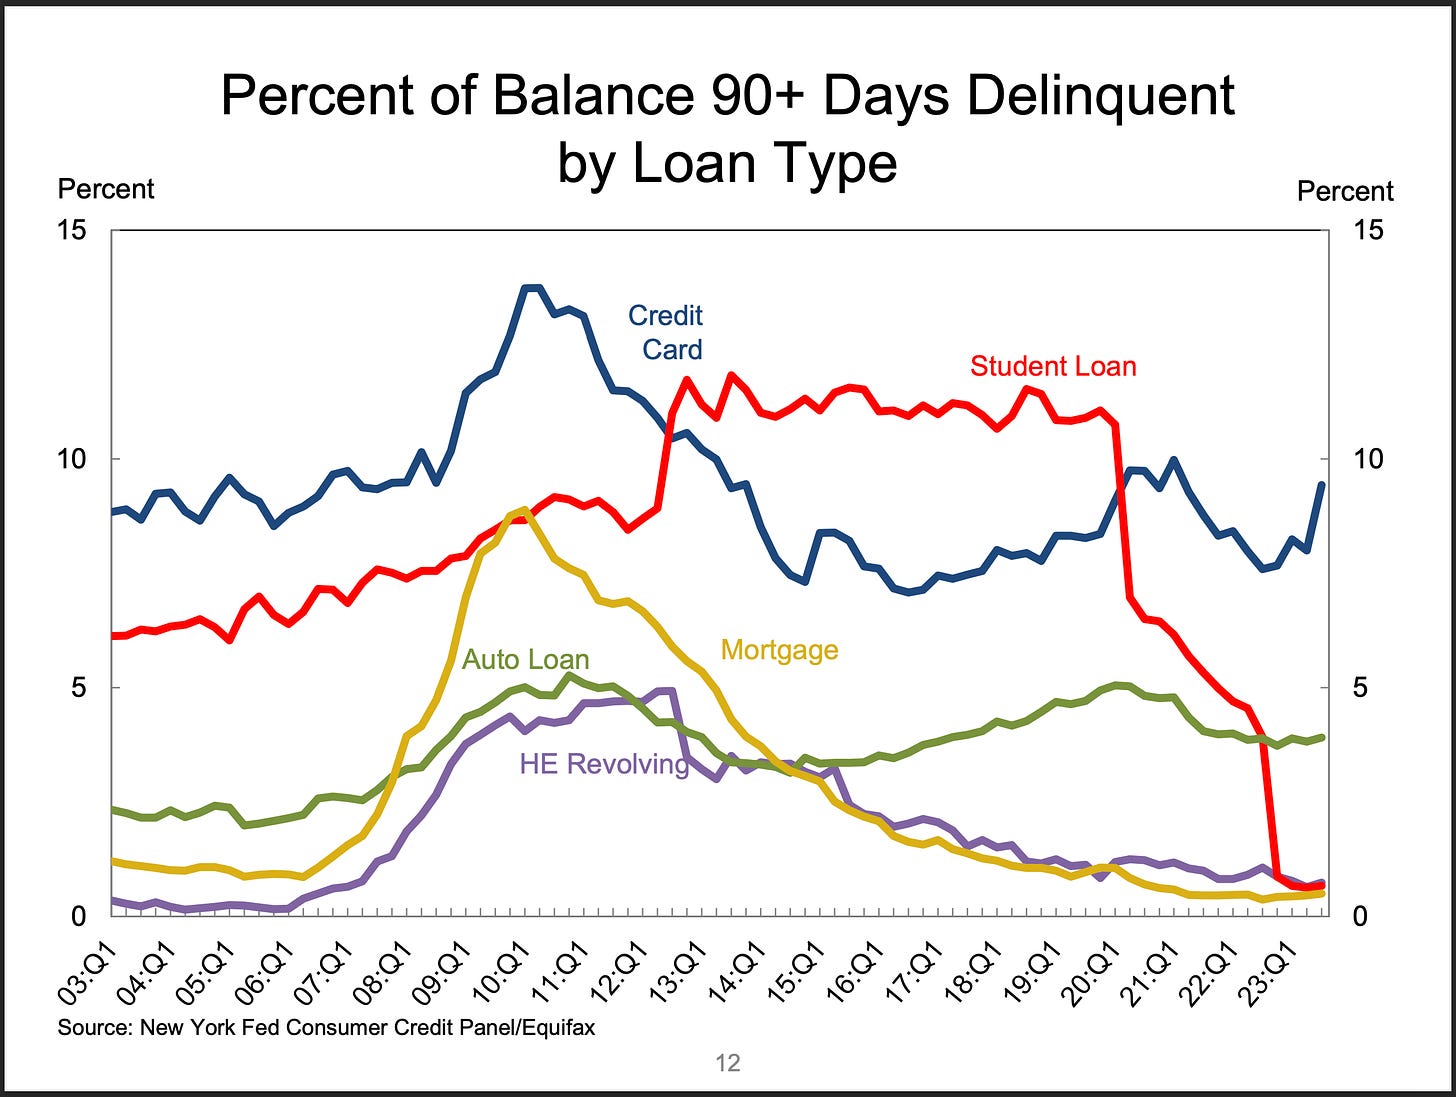
In other words, while the “flow” into new delinquency has been picking up, the “stock” of delinquencies remains below prepandemic levels.
“As of September, 3.0% of outstanding debt was in some stage of delinquency, up by 0.4 percentage points from the second quarter yet 1.7 percentage points lower than the fourth quarter of 2019,” New York Fed researchers wrote.
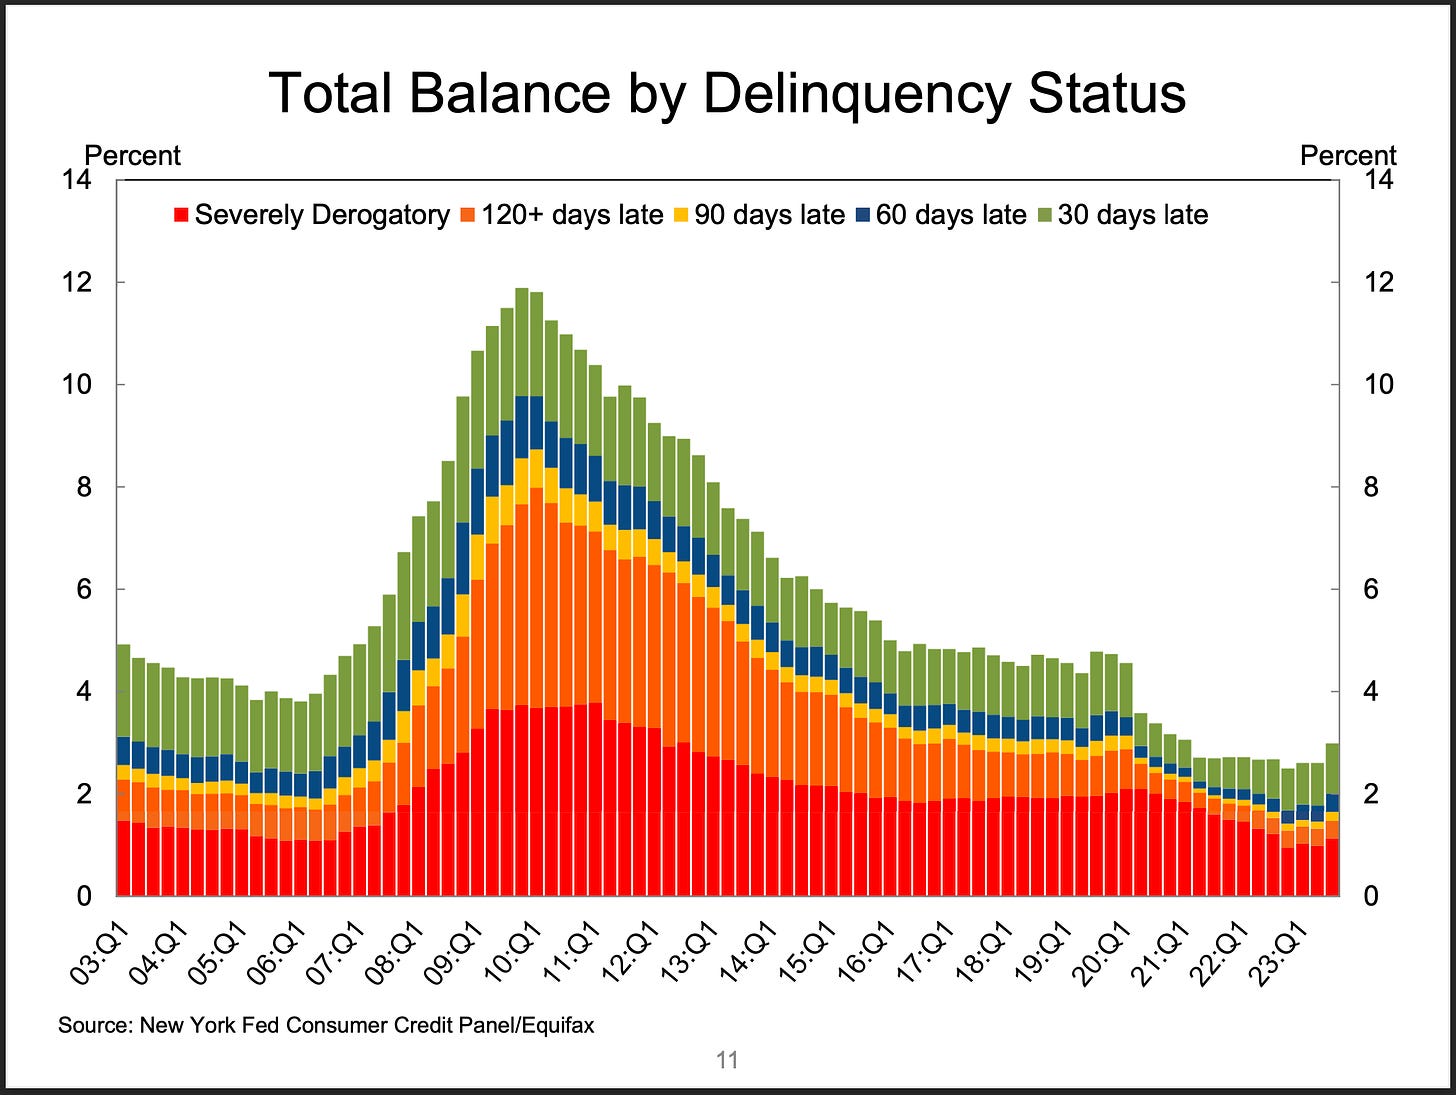
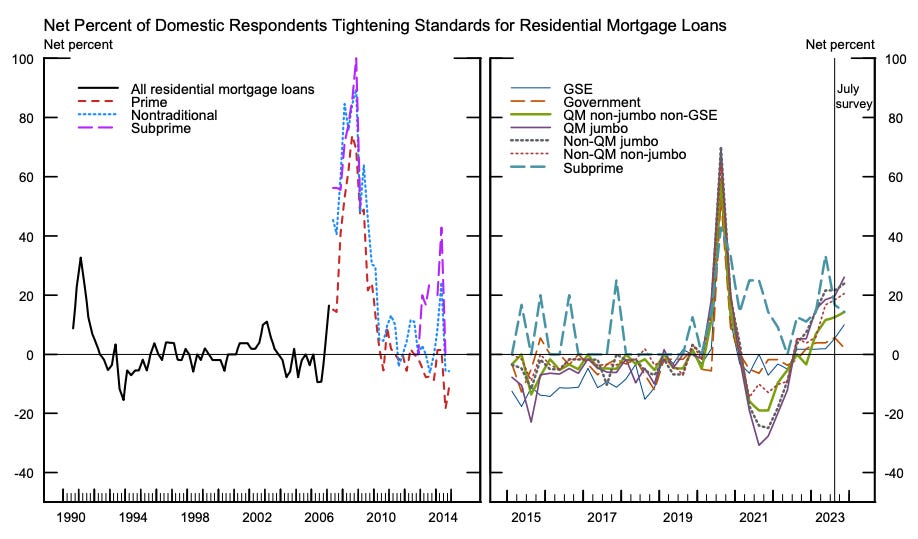
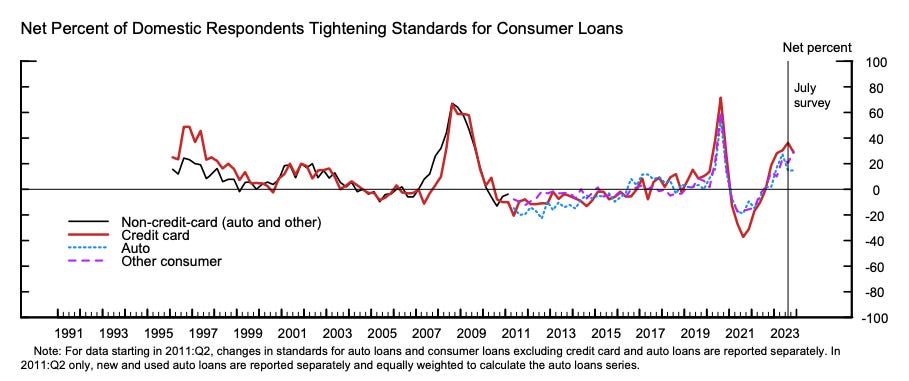
The rise in delinquencies comes as banks have been tightening lending standards.
According to the Federal Reserve’s October Senior Loan Officer Opinion Survey on Bank Lending Practices, lending standards have tightened for residential real estate loans…
… and for consumer loans.
There’s not much to celebrate here, especially if you are a consumer that’s affected or you are someone hoping for hotter economic growth.
These deteriorating metrics, however, do appear in line with the Federal Reserve’s ongoing efforts to bring down inflation by reining the economy by tightening monetary policy. Indeed, key labor market metrics have been cooling for over a year. Read more on the evolving labor market here, here, here, and here.
That said, it’s also arguably premature to conclude that the decelerating economy is destined to transition into one that’s in an outright recession.
“Overall this looks consistent with a softening trajectory for consumer spending, but not a particularly bad one,” JPMorgan’s Daniel Silver wrote in response to the HHDC report.
Make no mistake: Consumer finances continue to be in remarkably good shape.
“We have emphasized that household balance sheets look very strong after a long streak of deleveraging following the Global Financial Crisis, and this could reduce the need for most households to tighten their belts,” Oxford Economics’ Daniel von Ahlen wrote on Friday. “The surge in equity and home prices since the pandemic mean that household net worth is at record highs.”
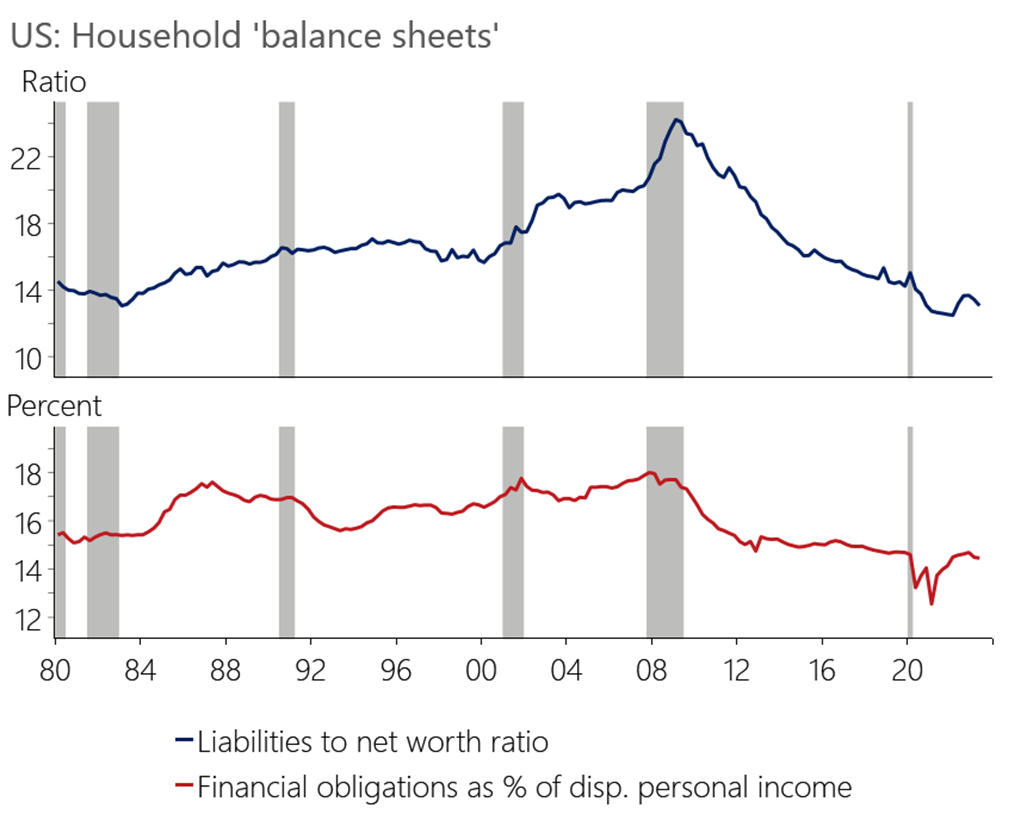
For more on the strength of consumer finances, read this, this, this, and this.
Keep in mind that the deteriorating credit metrics discussed above occurred during a period of robust GDP growth, supported by resilient consumer spending growth. And the economy continues to be supported by many other tailwinds pointing to more growth ahead.
So far, the resumption of student loan payments has had a limited effect on the consumer picture.
“We should also keep in mind that the 3Q [HHDC] report is probably too early to see potential negative effects of the end of forbearance on student loans, although the early read from some related data is that this likely will not end up being a huge drag on consumers,” JPM’s Silver said.
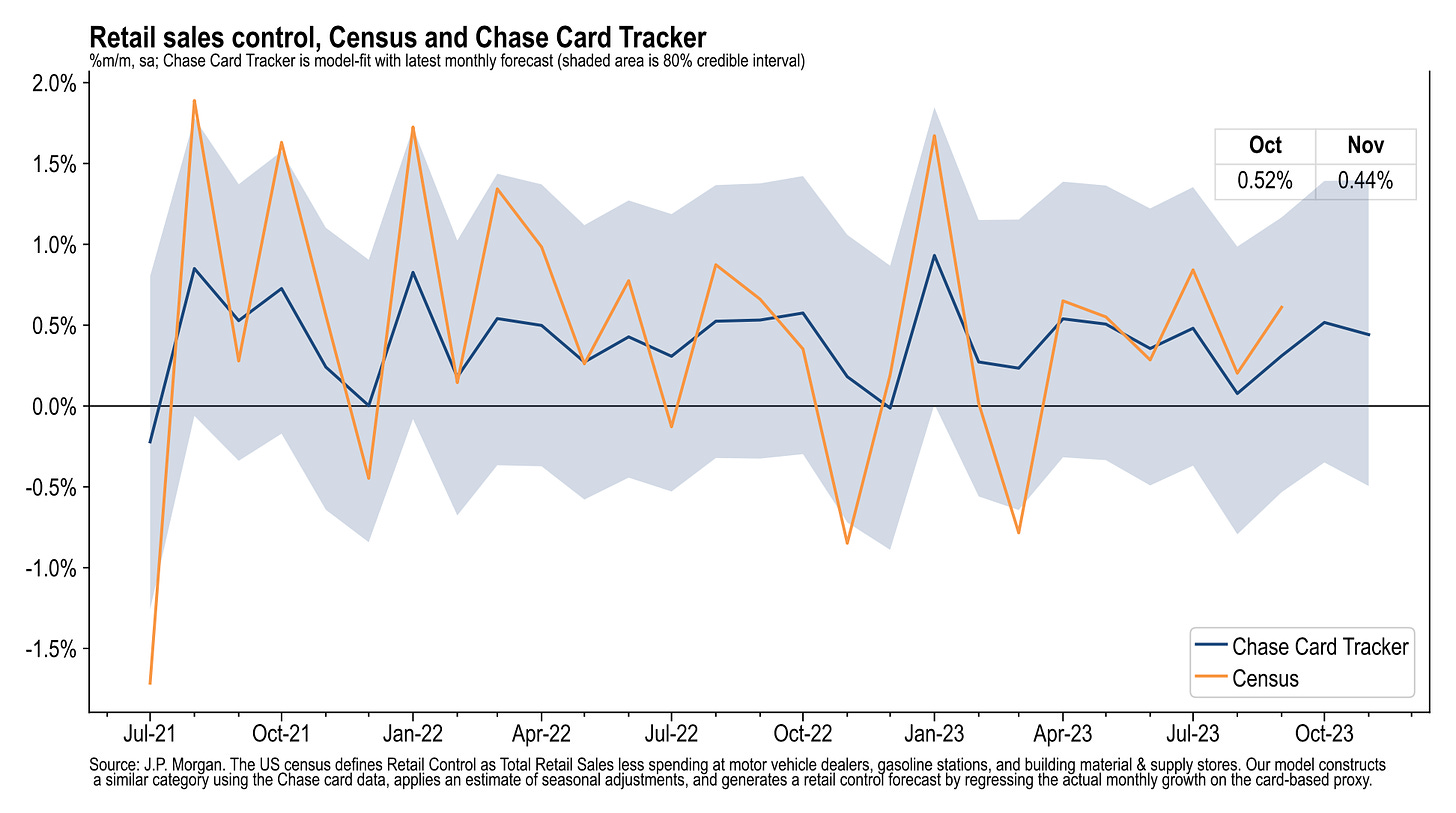
According to JPMorgan’s analysis, Chase Consumer Card spending data as of November 1 suggests the U.S. Census’ control measure of retail sales — which is used in calculating GDP growth — was up 0.52% month-over-month in October.
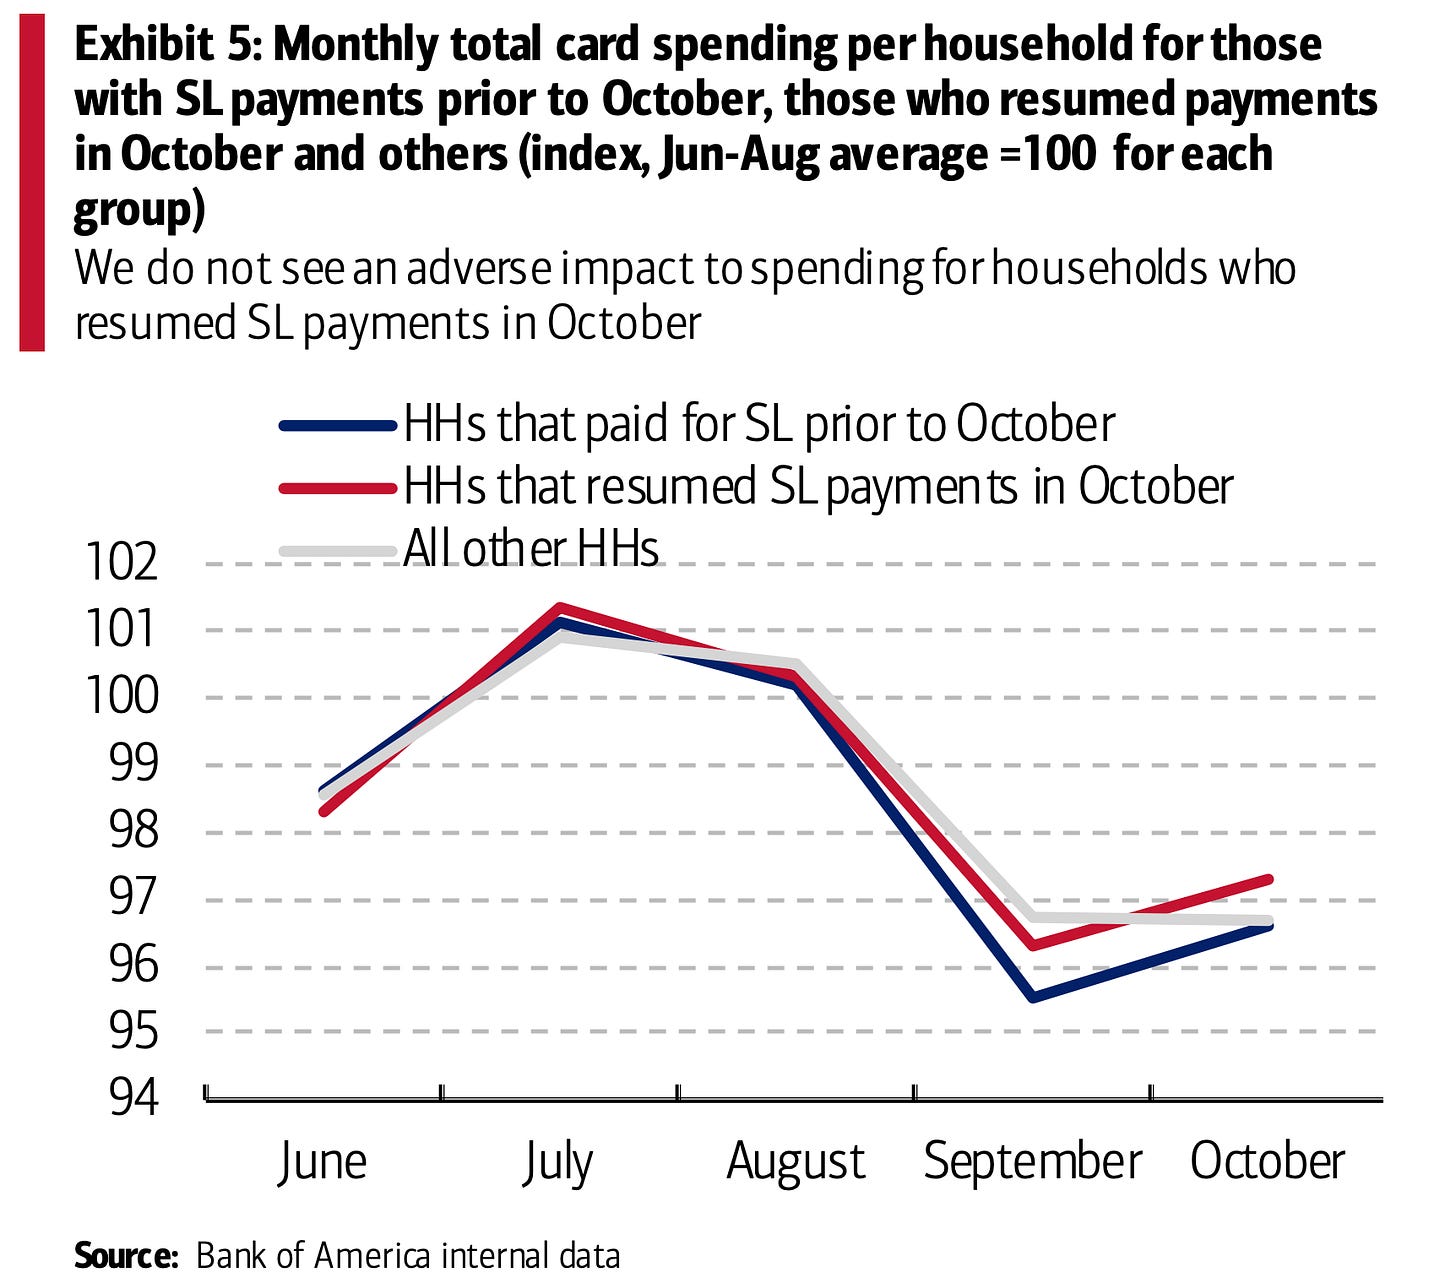
Citing their own proprietary data, Bank of America analysts found card spending declined by 0.2% in October.
“With the end of the student loan moratorium, many are wondering if consumers will cut back on spending to make loan repayments,” Bank of American analysts wrote. “When we look at the spending of households who made a [student loan] payment for the first time in 2023 in October, we do not see any obvious sign of an adverse impact relative to other groups of households.“
For more, read: What the restart of student loan payments could mean for the economy
Just because the stock market usually goes up and the economy is usually growing doesn’t mean they are always doing so.
Bear markets and recessions are unfortunate hurdles on the long-run path to building wealth in risk assets.
To reiterate, the overall data indicate continued economic growth — and consequently suggest a bullish “Goldilocks” soft landing scenario where inflation cools to manageable levels without the economy having to sink into recession.
But as the data continues to come in, we’ll have to be vigilant as we watch for signs that the economic narratives may be shifting.
–
Related from TKer:
There were a few notable data points and macroeconomic developments from last week to consider:
Moody’s turns negative on U.S. credit rating. On Friday, bond rating agency Moody’s changed its outlook for the U.S. government’s Aaa credit rating to “negative from stable.” From Moody’s: “The key driver of the outlook change to negative is Moody’s assessment that the downside risks to the US’ fiscal strength have increased and may no longer be fully offset by the sovereign’s unique credit strengths. In the context of higher interest rates, without effective fiscal policy measures to reduce government spending or increase revenues, Moody’s expects that the US’ fiscal deficits will remain very large, significantly weakening debt affordability. Continued political polarization within US Congress raises the risk that successive governments will not be able to reach consensus on a fiscal plan to slow the decline in debt affordability.“

A bond rating agency’s changed view on the U.S. usually isn’t as big a deal as it might sound.
For more on the U.S. government’s credit, read the Aug. 2 TKer: Some thoughts on the U.S. credit rating downgrade
Unemployment claims tick down. Initial claims for unemployment benefits fell to 217,000 during the week ending November 4, down from 220,000 the week prior. While this is up from a September 2022 low of 182,000, it continues to trend at levels associated with economic growth.
For more on the labor market, read: The hot but cooling labor market in 16 charts
Job switchers lose pay advantage as wage growth cools. According to the Atlanta Fed’s wage growth tracker, the gap wage growth between those who switch jobs and those who stay at their jobs continues to close. Job switchers saw 6.6% wage growth in the 12 months ending in October, whereas job stayers saw 5.3% growth during the period.
For more on why the Fed is concerned about high wage growth, read: The complicated mess of the markets and economy, explained
Mortgage rates fall, mortgage applications rise. From Bloomberg: “The average 30-year mortgage rate plunged last week by the most in more than a year, helping generate the biggest advance in home purchase applications since early June. The contract rate on a 30-year fixed mortgage slid 25 basis points to 7.61%, the lowest level since the end of September, according to the Mortgage Bankers Association. The group’s index of mortgage applications for home purchases increased 3% in the week ended Nov. 3, the data out Wednesday showed.“
For more, read: The U.S. housing market has gone cold
Pumping oil at a record pace. From Bloomberg: “U.S. crude production jumped to a record high of 13.05 million barrels a day in August, the US Energy Information Administration said [Oct. 31] in a monthly report. The output surpassed a previous high set in November 2019 of 13 million barrels a day. US crude has been playing an increasingly vital role in global oil markets due OPEC+ leaders Saudi Arabia and Russia extending production cuts.“
For more on energy prices, read: The other side of the surging oil price story
Gas prices fall. From AAA: “The national average for a gallon of gas dropped four cents since last week to $3.40. However, the steady, if slow, decline may gain speed after recent drops in the price of oil. Parked in the mid-$80s per barrel a week ago, oil is now hovering around the mid-$70s. Since it is the main ingredient in gasoline, less expensive oil usually leads to falling gas prices.”
Here’s an interesting way of thinking about gas prices from Justin Wolfers: The number of minutes of work it takes to pay for a gallon of gas.
For more on energy prices, read: The other side of the surging oil price story
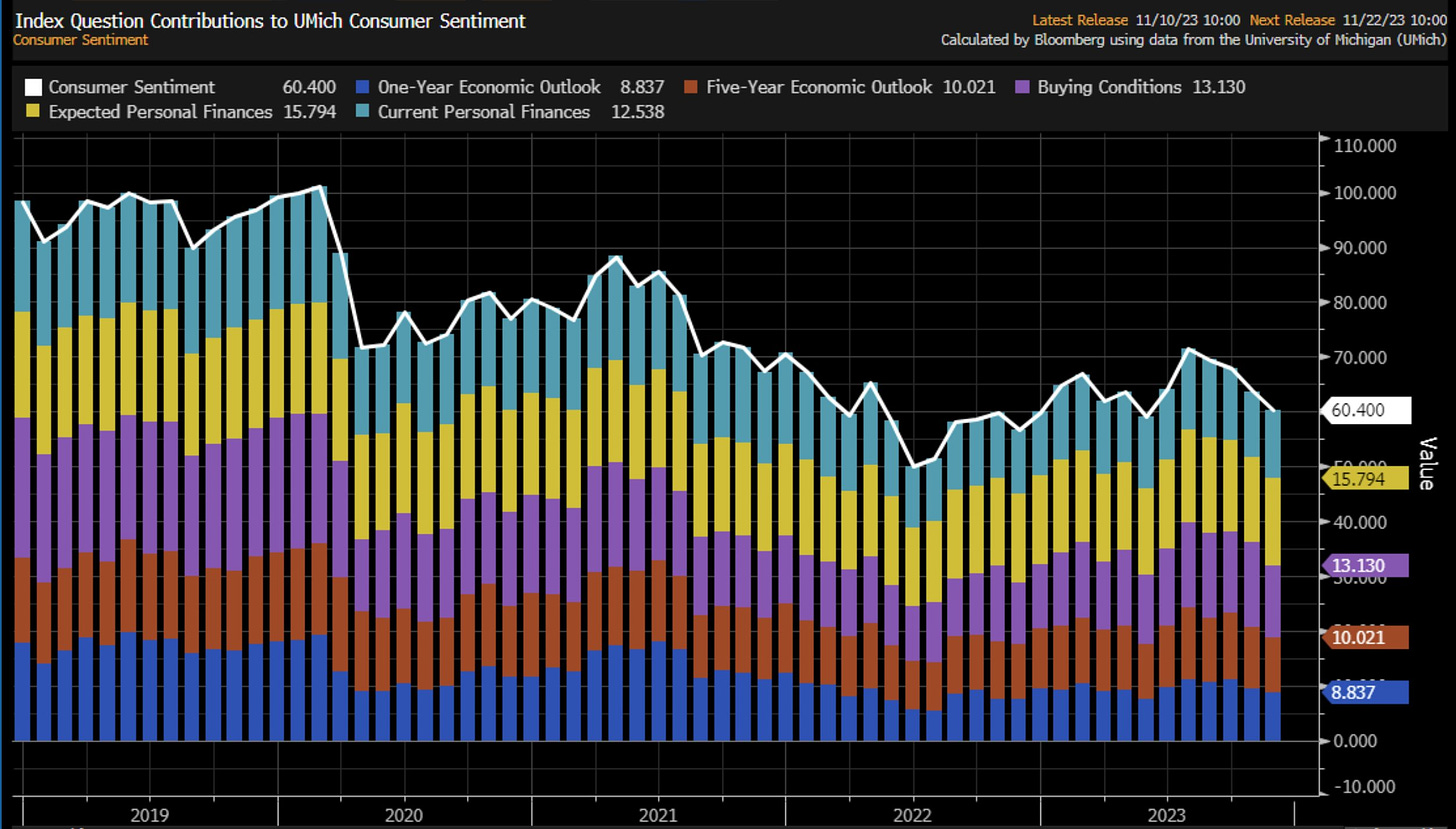
Consumer sentiment sours. From the University of Michigan’s November Surveys of Consumers: “Consumer sentiment slipped for the fourth straight month, falling 5% in November. While current and expected personal finances both improved modestly this month, the long-run economic outlook slid 12%, in part due to growing concerns about the negative effects of high interest rates. Ongoing wars in Gaza and Ukraine weighed on many consumers as well. Overall, lower-income consumers and younger consumers exhibited the strongest declines in sentiment. In contrast, sentiment of the top tercile of stock holders improved 10%, reflecting the recent strengthening in equity markets.“
Inventory levels are down. Wholesale inventories stood at $901.8 billion in September. The inventories/sales ratio was 1.33, down from 1.36 the previous year.
Supply chain pressures loosen. The New York Fed’s Global Supply Chain Pressure Index — a composite of various supply chain indicators — ticked lower in October and remains below levels seen even before the pandemic. That’s way down from its December 2021 supply chain crisis high.
For more on the supply chain, read: We can stop calling it a supply chain crisis
Near-term GDP growth estimates remain positive. The Atlanta Fed’s GDPNow model sees real GDP growth climbing at a 2.1% rate in Q4.
For more on the forces bolstering economic growth, read: 9 reasons to be optimistic about the economy and markets
We continue to get evidence that we could see a bullish “Goldilocks” soft landing scenario where inflation cools to manageable levels without the economy having to sink into recession.
This comes as the Federal Reserve continues to employ very tight monetary policy in its ongoing effort to bring inflation down. While it’s true that the Fed has taken a less hawkish tone in 2023 than in 2022, and that most economists agree that the final interest rate hike of the cycle has either already happened or is near, inflation still has to cool more and stay cool for a little while before the central bank is comfortable with price stability.
So we should expect the central bank to keep monetary policy tight, which means we should be prepared for tight financial conditions (e.g., higher interest rates, tighter lending standards, and lower stock valuations) to linger. All this means monetary policy will be unfriendly to markets for the time being, and the risk the economy slips into a recession will be relatively elevated.
At the same time, we also know that stocks are discounting mechanisms — meaning that prices will have bottomed before the Fed signals a major dovish turn in monetary policy.
Also, it’s important to remember that while recession risks may be elevated, consumers are coming from a very strong financial position. Unemployed people are getting jobs, and those with jobs are getting raises.
Similarly, business finances are healthy as many corporations locked in low interest rates on their debt in recent years. Even as the threat of higher debt servicing costs looms, elevated profit margins give corporations room to absorb higher costs.
At this point, any downturn is unlikely to turn into economic calamity given that the financial health of consumers and businesses remains very strong.
And as always, long-term investors should remember that recessions and bear markets are just part of the deal when you enter the stock market with the aim of generating long-term returns. While markets have had a pretty rough couple of years, the long-run outlook for stocks remains positive.
For more on how the macro story is evolving, check out the the previous TKer macro crosscurrents »
Here’s a roundup of some of TKer’s most talked-about paid and free newsletters about the stock market. All of the headlines are hyperlinked to the archived pieces.
The stock market can be an intimidating place: It’s real money on the line, there’s an overwhelming amount of information, and people have lost fortunes in it very quickly. But it’s also a place where thoughtful investors have long accumulated a lot of wealth. The primary difference between those two outlooks is related to misconceptions about the stock market that can lead people to make poor investment decisions.
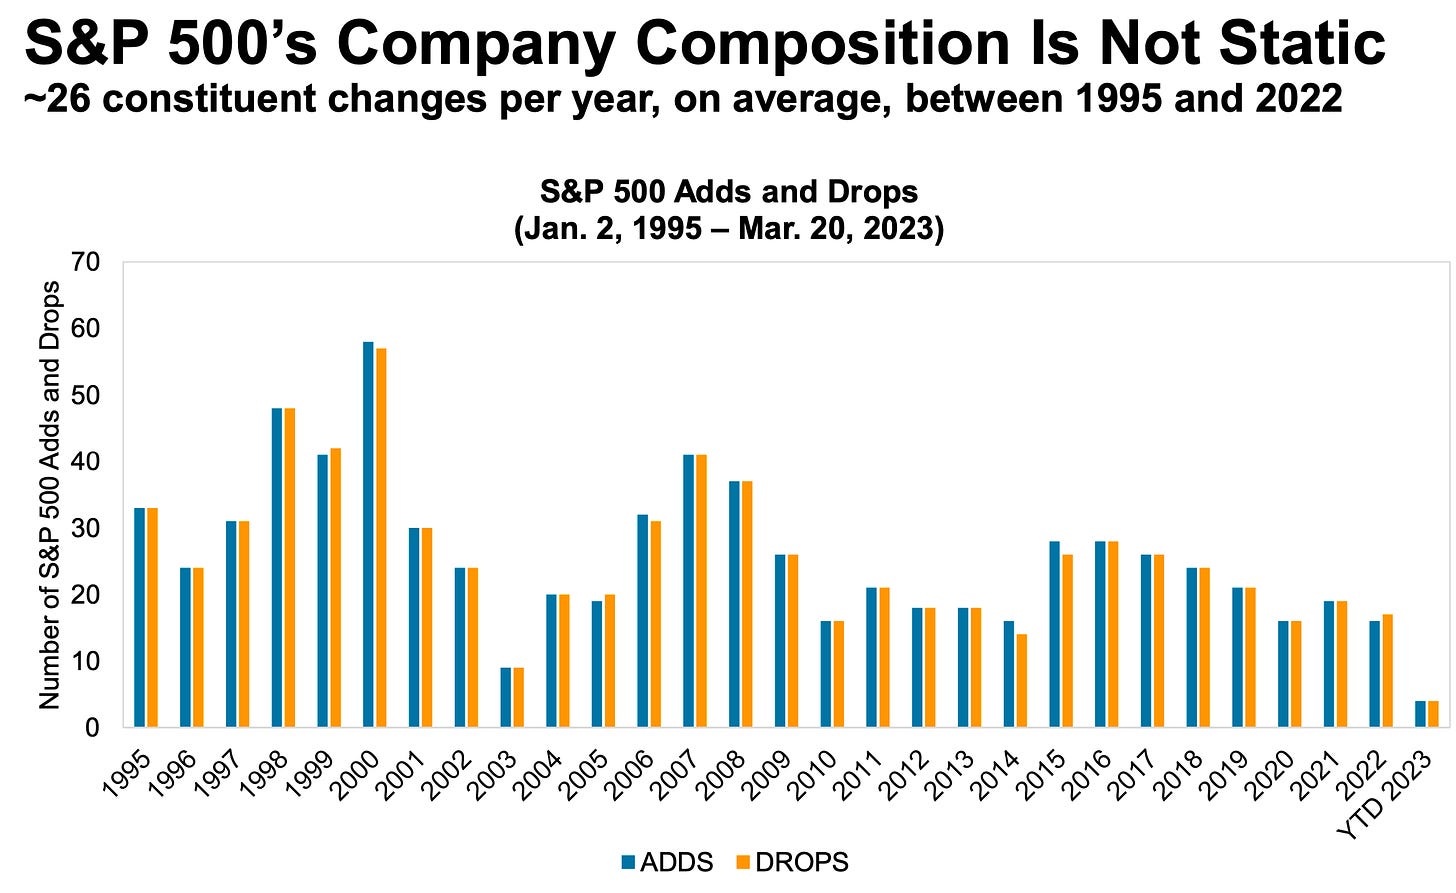
Passive investing is a concept usually associated with buying and holding a fund that tracks an index. And no passive investment strategy has attracted as much attention as buying an S&P 500 index fund. However, the S&P 500 — an index of 500 of the largest U.S. companies — is anything but a static set of 500 stocks.
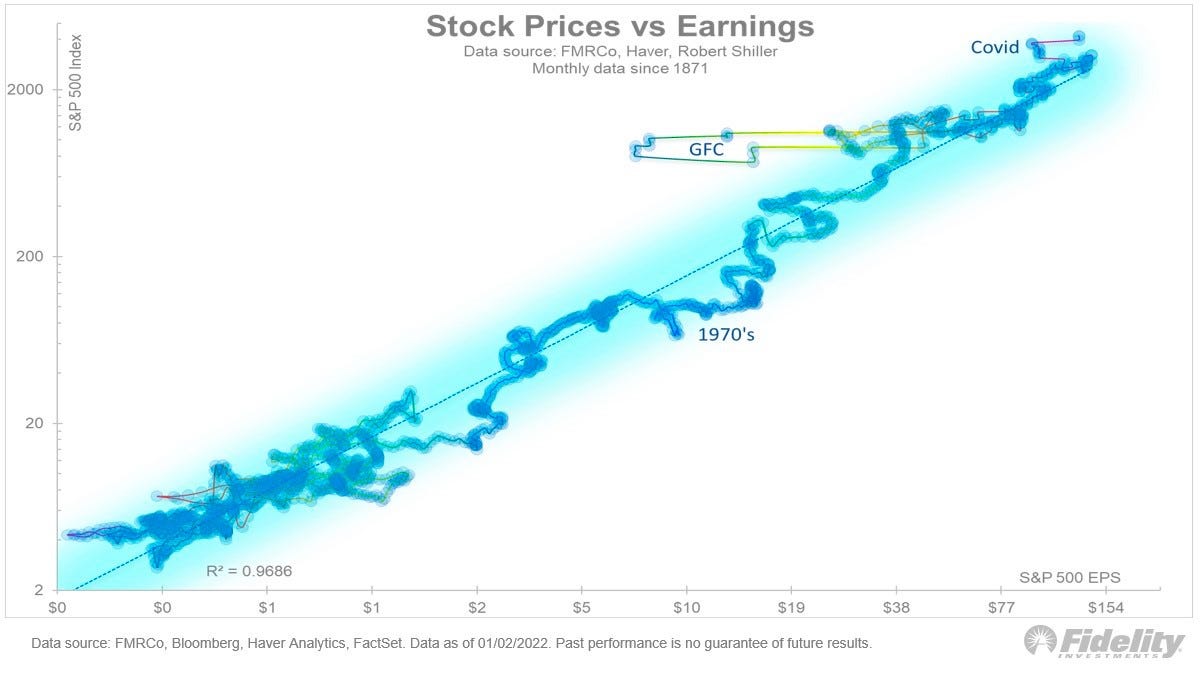
For investors, anything you can ever learn about a company matters only if it also tells you something about earnings. That’s because long-term moves in a stock can ultimately be explained by the underlying company’s earnings, expectations for earnings, and uncertainty about those expectations for earnings. Over time, the relationship between stock prices and earnings have a very tight statistical relationship.
Investors should always be mentally prepared for some big sell-offs in the stock market. It’s part of the deal when you invest in an asset class that is sensitive to the constant flow of good and bad news. Since 1950, the S&P 500 has seen an average annual max drawdown (i.e., the biggest intra-year sell-off) of 14%.

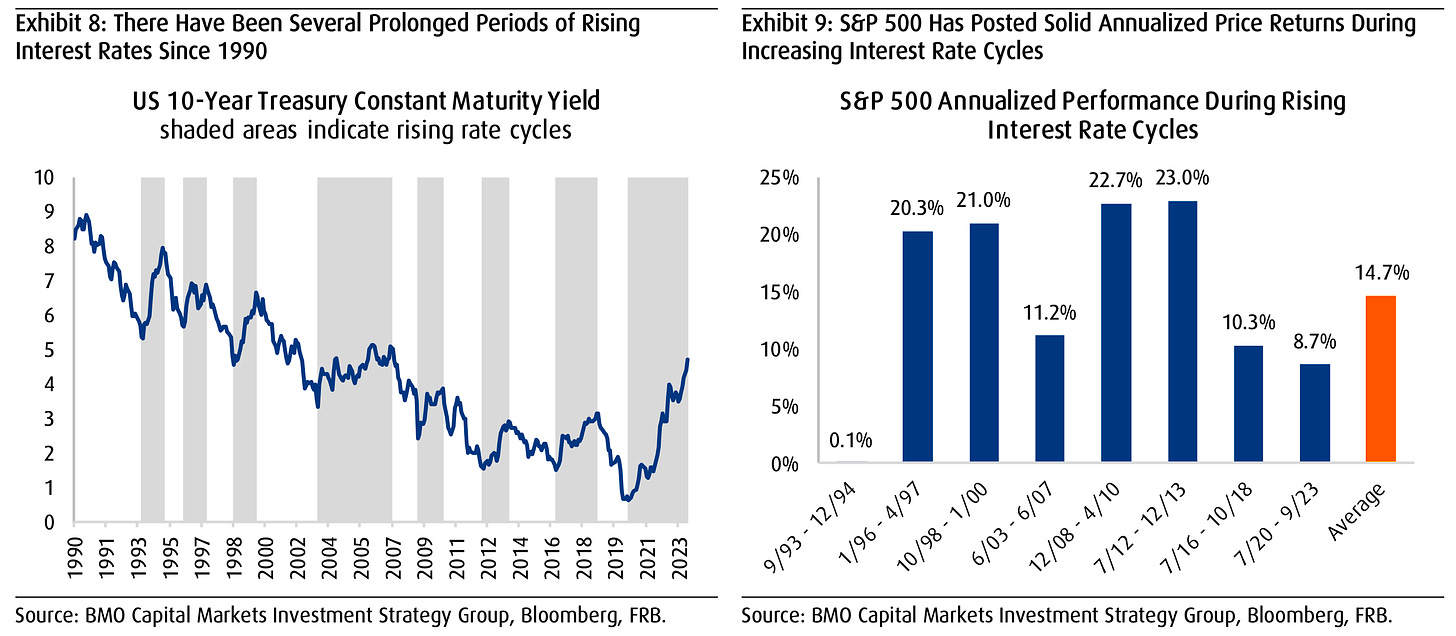
Generally speaking, rising interest rates are not welcome news for the economy and the stock market. They represent higher financing costs for businesses and consumers. All other things being equal, rising rates represent a hindrance to growth. However, the world is complicated, and this narrative comes with a lot of nuance. One big counterintuitive piece to this narrative is that historically, stocks have actually performed well during periods of rising interest rates.
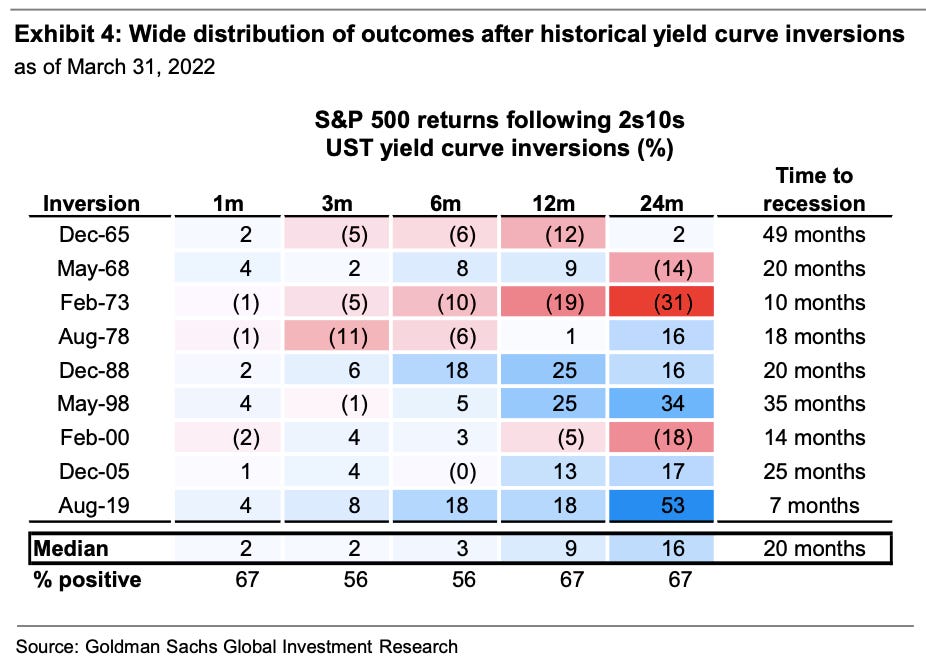
There’ve been lots of talk about the “yield curve inversion,” with media outlets playing up that this bond market phenomenon may be signaling a recession. Admittedly, yield curve inversions have a pretty good track record of being followed by recessions, and recessions usually come with significant market sell-offs. But experts also caution against concluding that inverted yield curves are bulletproof leading indicators.
Every recession in history was different. And the range of stock performance around them varied greatly. There are two things worth noting. First, recessions have always been accompanied by a significant drawdown in stock prices. Second, the stock market bottomed and inflected upward long before recessions ended.

Since 1928, the S&P 500 generated a positive total return more than 89% of the time over all five-year periods. Those are pretty good odds. When you extend the timeframe to 20 years, you’ll see that there’s never been a period where the S&P 500 didn’t generate a positive return.
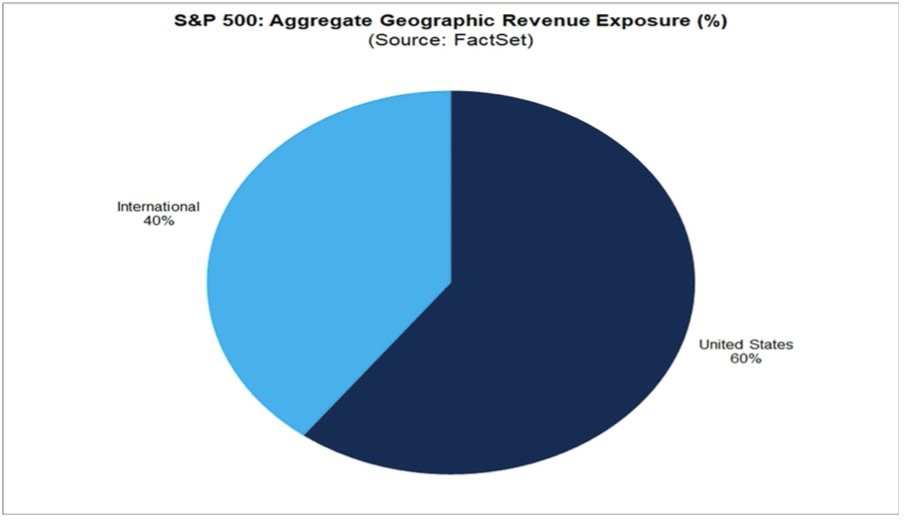
While a strong dollar may be great news for Americans vacationing abroad and U.S. businesses importing goods from overseas, it’s a headwind for multinational U.S.-based corporations doing business in non-U.S. markets.
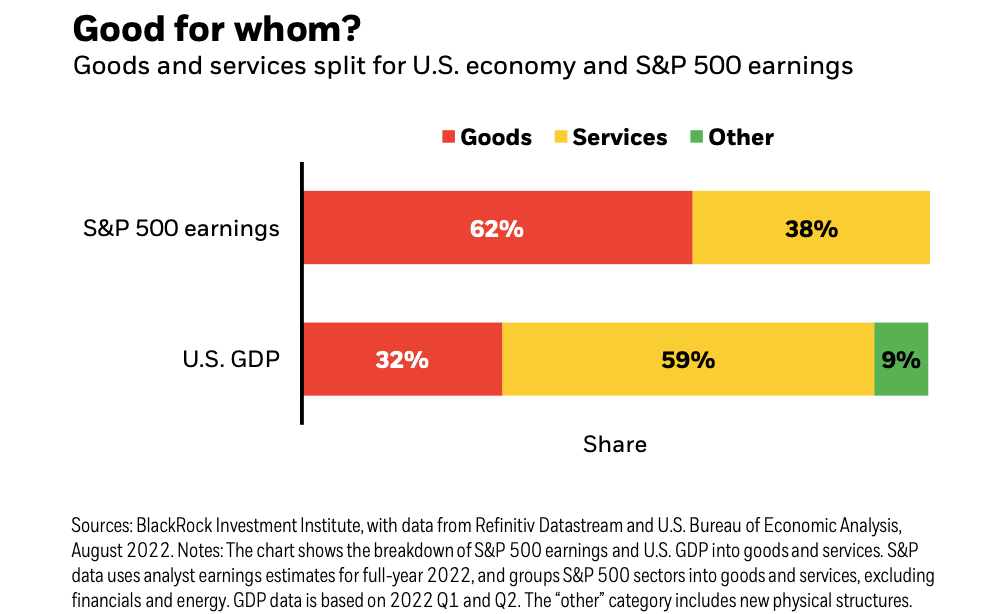
The stock market sorta reflects the economy. But also, not really. The S&P 500 is more about the manufacture and sale of goods. U.S. GDP is more about providing services.
…you don’t want to buy them when earnings are great, because what are they doing when their earnings are great? They go out and expand capacity. Three or four years later, there’s overcapacity and they’re losing money. What about when they’re losing money? Well, then they’ve stopped building capacity. So three or four years later, capacity will have shrunk and their profit margins will be way up. So, you always have to sort of imagine the world the way it’s going to be in 18 to 24 months as opposed to now. If you buy it now, you’re buying into every single fad every single moment. Whereas if you envision the future, you’re trying to imagine how that might be reflected differently in security prices.
Some event will come out of left field, and the market will go down, or the market will go up. Volatility will occur. Markets will continue to have these ups and downs. … Basic corporate profits have grown about 8% a year historically. So, corporate profits double about every nine years. The stock market ought to double about every nine years… The next 500 points, the next 600 points — I don’t know which way they’ll go… They’ll double again in eight or nine years after that. Because profits go up 8% a year, and stocks will follow. That’s all there is to it.
Long ago, Sir Isaac Newton gave us three laws of motion, which were the work of genius. But Sir Isaac’s talents didn’t extend to investing: He lost a bundle in the South Sea Bubble, explaining later, “I can calculate the movement of the stars, but not the madness of men.” If he had not been traumatized by this loss, Sir Isaac might well have gone on to discover the Fourth Law of Motion: For investors as a whole, returns decrease as motion increases.
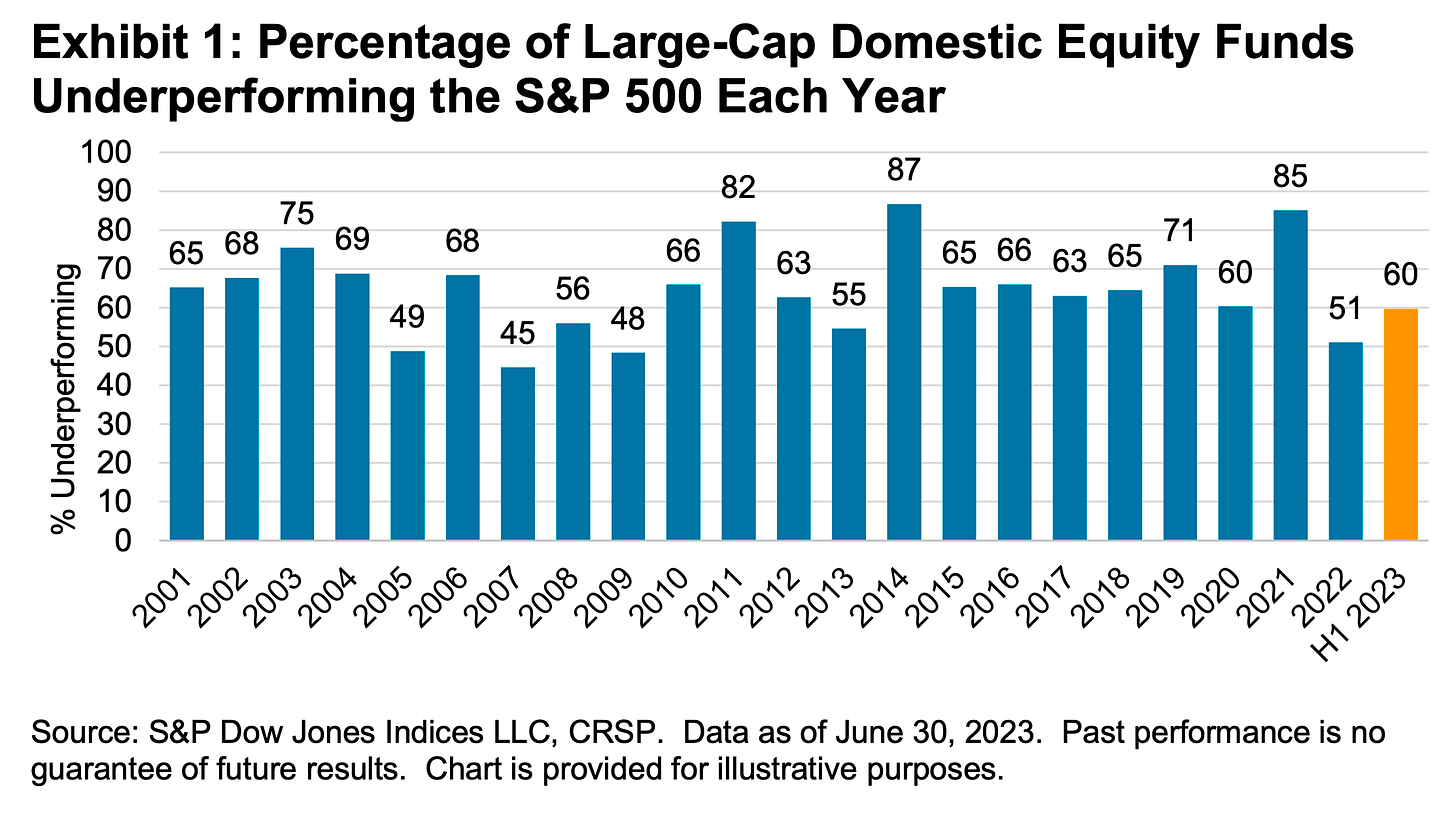
According to S&P Dow Jones Indices (SPDJI), 59.7% of U.S. large-cap equity fund managers underperformed the S&P 500 during the first half of 2023. As you stretch the time horizon, the numbers get more dismal. Over a three-year period, 79.8% underperformed. Over a 10-year period, 85.6% underperformed. And over a 20-year period, 93.6% underperformed.
S&P Dow Jones Indices found that funds beat their benchmark in a given year are rarely able to continue outperforming in subsequent years. For example, 318 large-cap equity funds were in the top half of performance in 2020. Of those funds, 39% came in the top half again in 2021, and just 5% were able to extend that streak through 2022. If you set the bar even higher and consider those in the top quartile of performance, just 7% of 156 large-cap funds remained in the top quartile in 2021. No large-cap funds were able to stay in the top quartile for the three consecutive years ending in 2022.

Picking stocks in an attempt to beat market averages is an incredibly challenging and sometimes money-losing effort. In fact, most professional stock pickers aren’t able to do this on a consistent basis. One of the reasons for this is that most stocks don’t deliver above-average returns. According to S&P Dow Jones Indices, only 24% of the stocks in the S&P 500 outperformed the average stock’s return from 2000 to 2022. Over this period, the average return on an S&P 500 stock was 390%, while the median stock rose by just 93%.

Credit: Source link


