Note: A version of this article was published on TKer.co.
Stocks fell last week, with the S&P 500 shedding 2.4% to close at 4,224.16, the lowest level since June 1. The index is now up 10% year to date, up 18.1% from its October 12, 2022 closing low of 3,577.03, and down 11.9% from its January 3, 2022 record closing high of 4,796.56.
There seems to be a lot on investors’ minds lately. Fortunately, there are also lots of really smart people sharing charts that help contextualize all these issues. Below are a few that were circulating over the past week.
Year 2 is usually good
October 12 was the anniversary of the bear market low, marking the beginning of the second year of the current bull market. Here’s Oppenheimer’s Ari Wald on the historical comparisons: “…we define a cycle low as an 18-month low. … Our analysis indicates year 2 following a major low has been positive in 19 out of 22 cycles (86% of the time; the misses occurred in 1932, 1947, and 1960), and we’ve found little relationship between year 1’s magnitude and year 2’s return.”
Quick take: The stock market usually goes up, and this is more evidence of that. Since 1950, the stock market has been in a bull market 83% of the time.
Don’t expect smooth sailing
BMO’s Brian Belski also observed that bull markets usually extend through year two, but he cautioned that a correction would be normal. From his research note Wednesday: “…despite history pointing to lower volatility in the months ahead, we still believe there will likely be some choppiness along the way as the believability of the bull market continues to get questioned. As Exhibit 6 shows, the S&P 500 has still averaged a roughly 10% max drawdown in the second year of bull markets.”
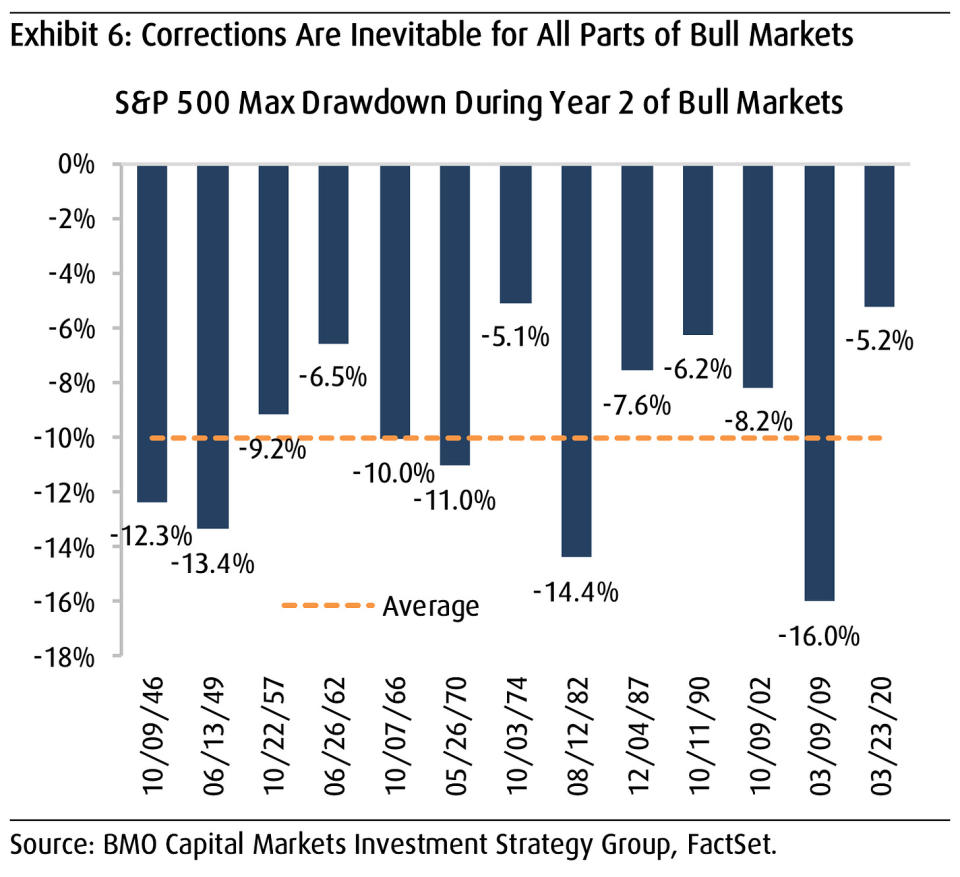
Quick take: There’s a reason why TKer Stock Market Truth No. 2 is: “You can get smoked in the short term.”
It’s the the good part of the presidential cycle
Stocks have been following a familiar pattern this year. Here’s Carson Group’s Ryan Detrick: “The third year of a new President tends to see strength the first half of the year (check), then chop into Thanksgiving (so far a check) and then a strong rally into the election year.”
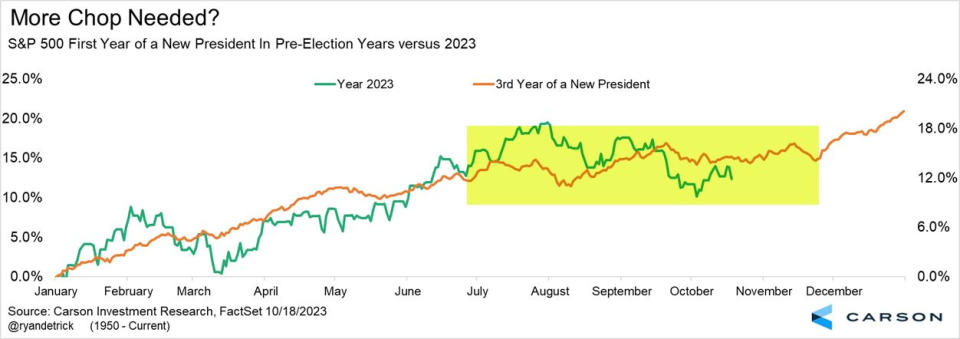
Quick take: I wouldn’t go all-in on the idea that stocks will move higher from now into year-end. The stock market is just too unpredictable during these extremely short-term periods.
Bonds are becoming more attractive relative to stocks
All eyes have been on rising interest rates. Rising interest rates have made asset classes like cash and bonds appear increasingly attractive relative to stocks, and stock dividend yields aren’t much higher and valuation ratios aren’t particularly compelling. X user Quantian1 observed that the yield on the 30-year Treasury bond is now higher than the S&P 500’s earnings yield (that is, earnings / price).
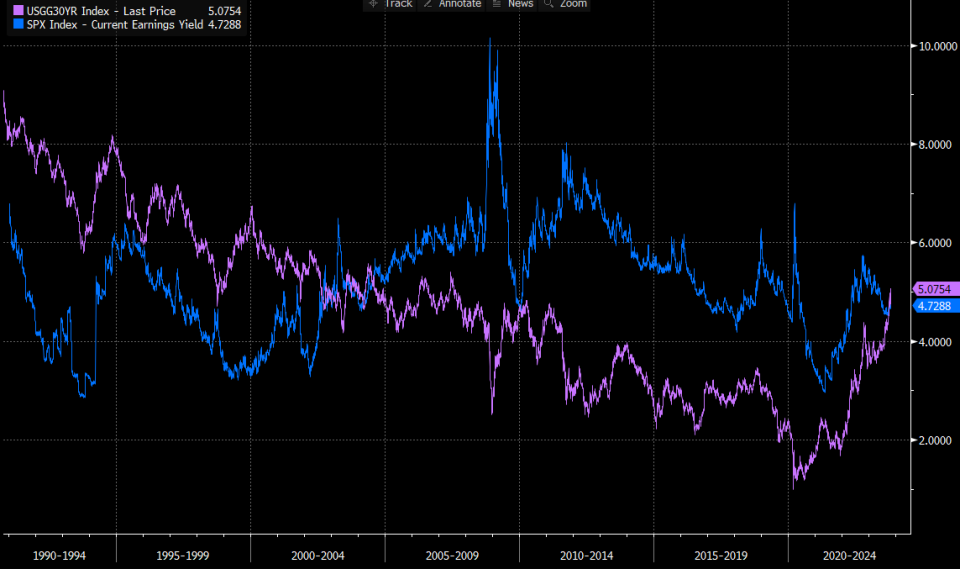
Quick take: The risk profiles and return opportunities for these various asset classes are very different. For example, companies can grow the earnings that go into those earnings yield calculations, and earnings are the most important long-term driver of stock prices.
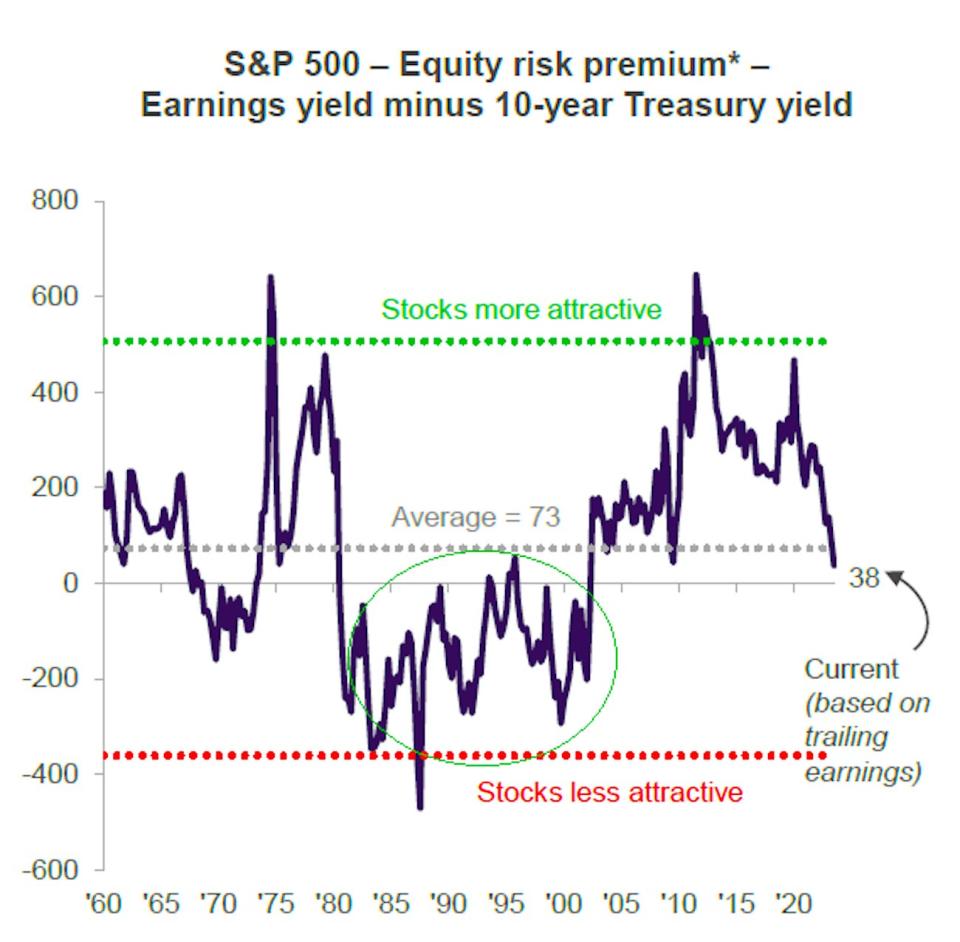
CNBC’s Michael Santoli shared a chart of a calculation of the equity risk premium (that is, the difference between the earnings yield and the Treasury yield). Similar to the chart above, it shows that stocks haven’t been this unattractive to bonds in two decades. But Santoli had some good perspective critiquing the metric when he was on Morningstar’s The Long View podcast:
“So, when we go back to that spread between the earnings yield of the S&P 500 and let’s say, the 10-year Treasury, right now, that seems like there’s just no valuation cushion at all for stocks. We’re as low as we’ve been in 20 years-ish. But if you go back to the ‘80s and ‘90s, this level was absolutely routine and unremarkable, and the market went up most of that time… I guess, my big point is, I just don’t have a lot of faith in the precision of those relationships. The biggest equity bubble in history happened when yields were at 5% and 6% and 7%… I don’t have a ton of confidence in the precision of those relationships because it’s very regime-specific.”
Lots more to say on this, but that’s all for now.
The end of Fed rate hikes usually isn’t bad
With inflation rates cooling towards the Federal Reserve’s target levels, Fed Chair Jerome Powell and his central bank colleagues have increasingly signaled the last interest rate hike is near or has already happened. History says that usually isn’t a bad sign for stocks. From Bloomberg’s Gina Martin Adams: “No such thing as a bad Fed pause, as far as stocks are concerned. There have been six instances since 1970 in which the Fed raised rates by over 100 bps for a period of a year or more, then paused for at least 3 mos. The S&P 500 was up all 6 times during the 3 mos, an avg 8.2%.”
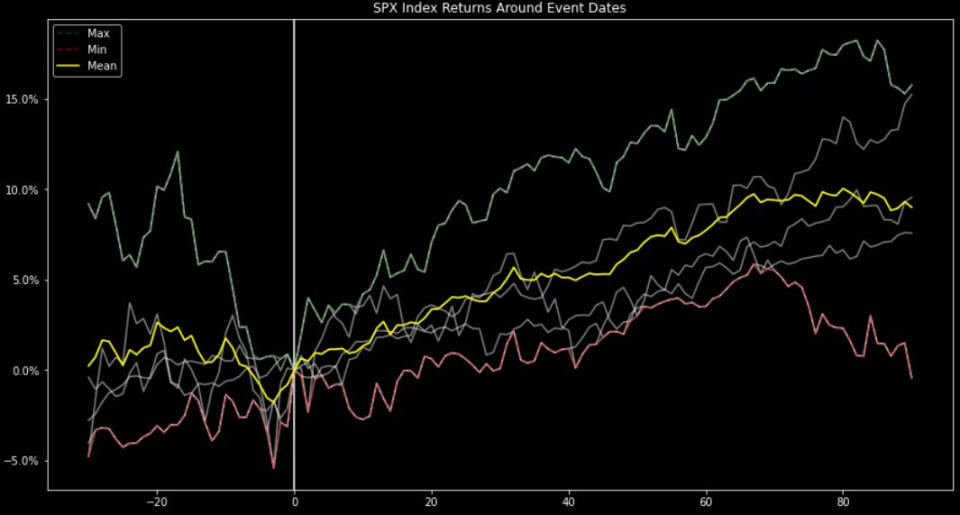
Quick take: I think I’d be more concerned if the end of rate hikes this cycle were happening amid a high likelihood of a recession. But recession odds have been falling.
Higher rates aren’t yet crushing profits
Despite three years of rising interest rates, interest expenses haven’t really budged for S&P 500 companies. From BofA: “The effective interest rate is on the rise, but only back to pre-COVID levels.”
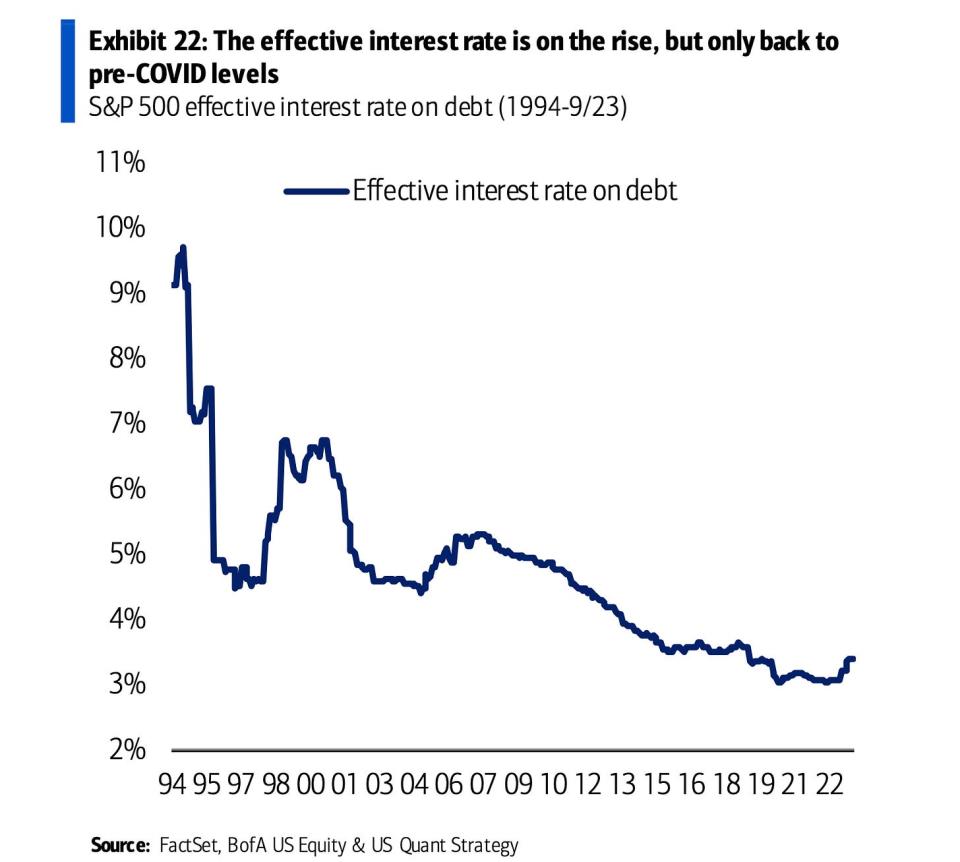
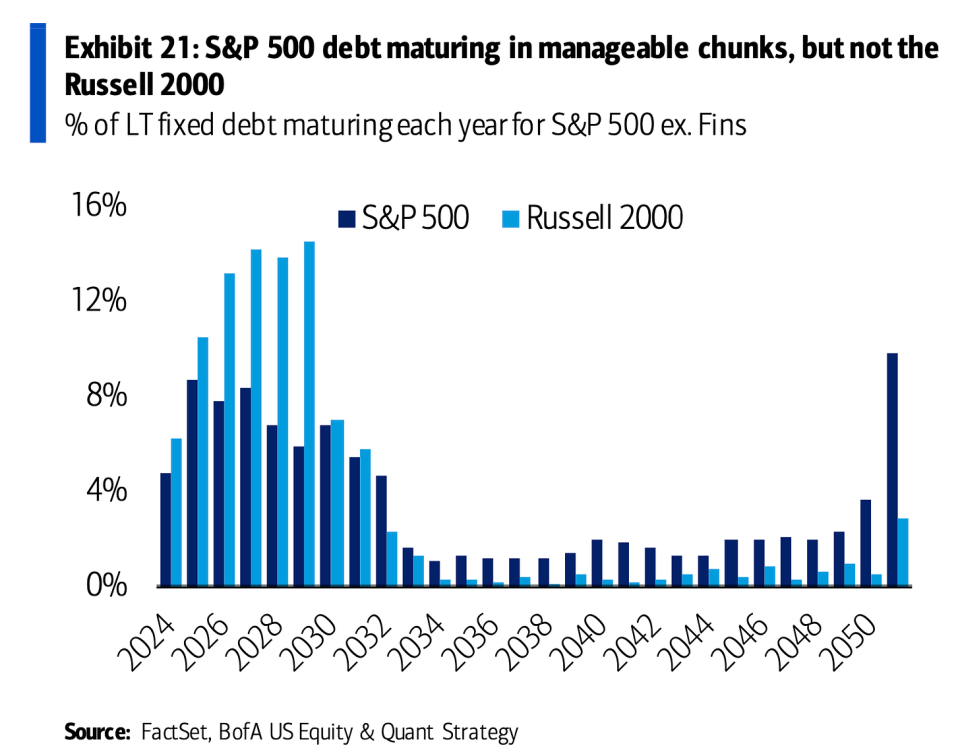
Quick take: The big S&P 500 companies continue to benefit from the fact they refinanced much of their debt in recent years, locking in historically low rates. This has bought them time to make adjustments to their operating and capital structures should they need to refinance again at much higher rates.
It’s worth noting the urgency is a bit higher for small cap companies as they have much more debt maturing in the coming years.
Cash levels are coming down from elevated levels
From Goldman Sachs: “S&P 500 cash balances fell by 4% during the past 12 months. Cash to assets for the aggregate index now ranks in the 13th percentile since 2010 and in the 9th percentile for the typical stock. The challenge of weaker cash balances will be compounded by the more restrictive financing environment. … Higher rates will reduce the appeal of using debt to fund large cash spending plans, given the potential for higher borrowing costs.”
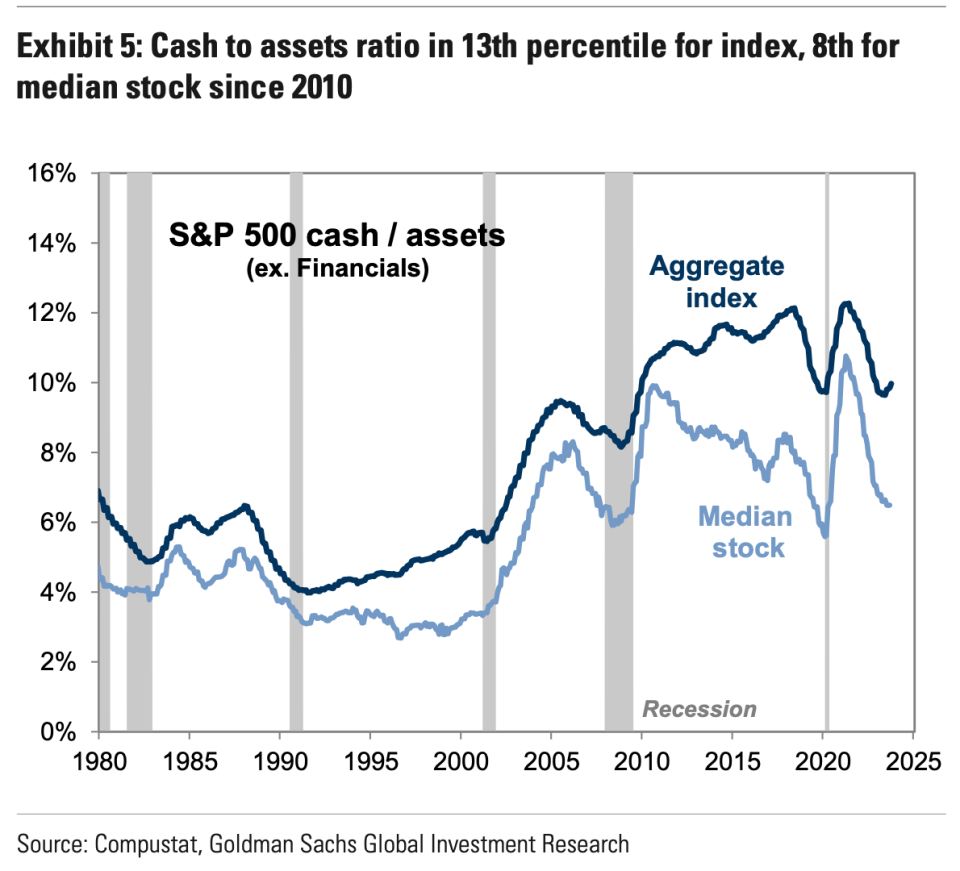
Quick take: Falling cash levels would be worse if it weren’t occurring from historically high levels. That said, this bears watching, especially should high interest rates persist.
Companies are getting more out of their workers
The revenue per worker that S&P 500 companies are getting is historically high. From BofA’s Savita Subramanian: “Labor efficiency has been inching toward the record high from 2008.”
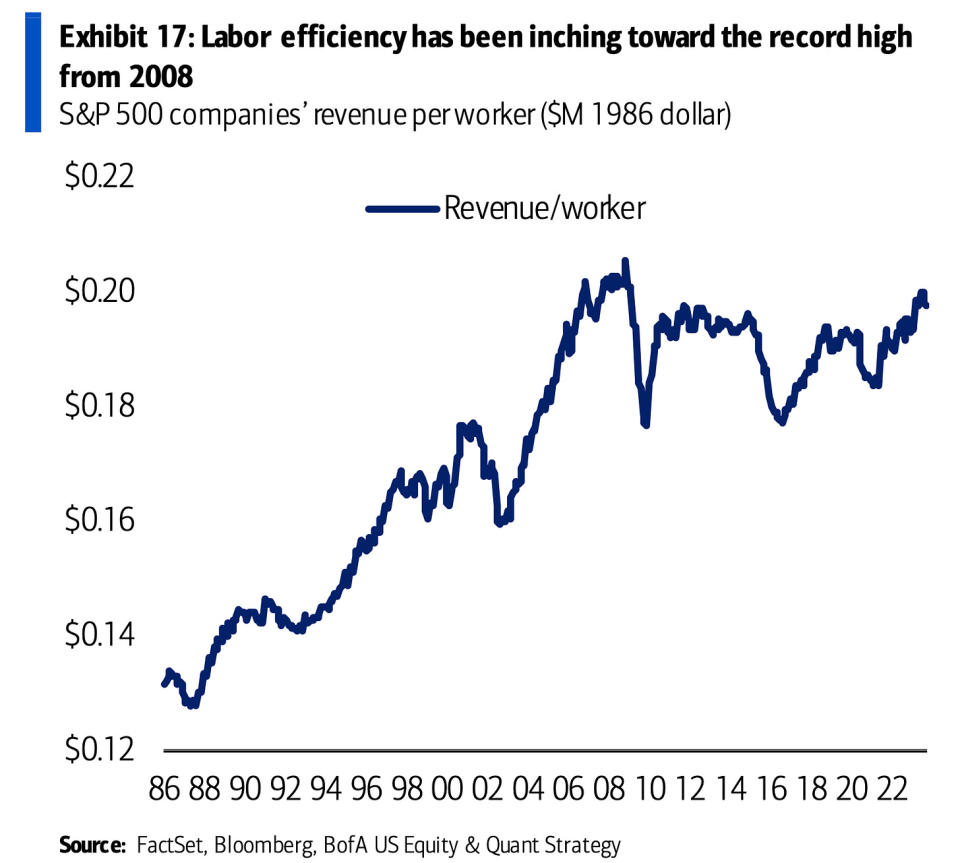
Quick take: On one hand, this has been bullish for corporate profit margins. On the other hand, it’s no wonder so many workers are demanding higher wages and going on strike.
The earnings outlook remains favorable
Despite all the headwinds we’ve read and heard about, analysts expect next-12 month earnings to hit record highs.
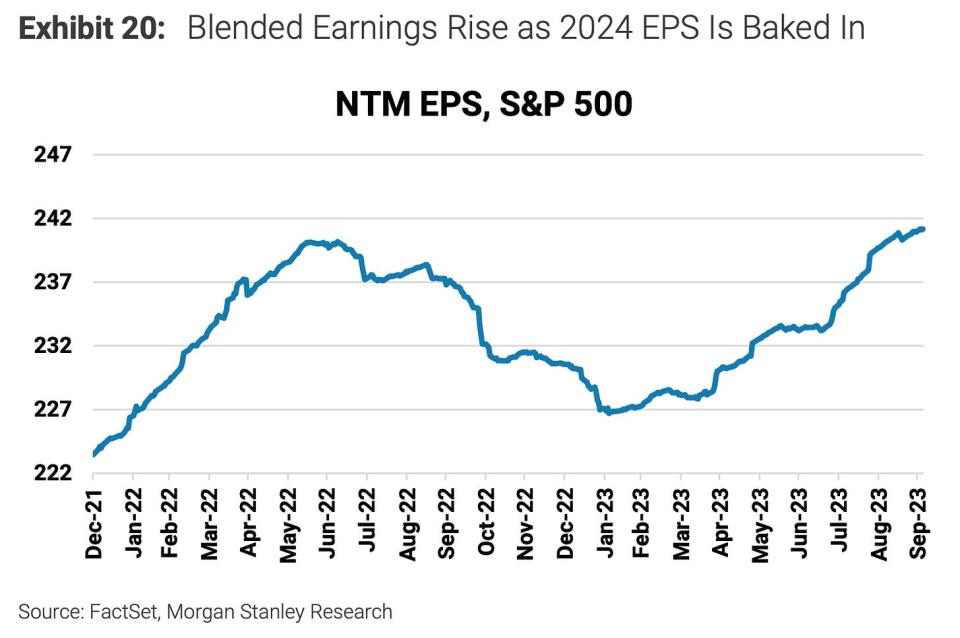
Quick take: As I’ve argued in TKer Stock Market Truth No. 5: “Any long term move in a stock can ultimately be explained by the underlying company’s earnings, expectations for earnings, and uncertainty about those expectations for earnings. News about the economy or policy moves markets to the degree they are expected to impact earnings. Earnings (a.k.a. profits) are why you invest in companies.”
Despite all of the concerns out there, we continue to get data confirming that job creation remains robust, personal consumption continues to grow, and capex orders continue to point to more business expansion. All of this points to more economic growth, economic growth helps drive earnings growth, and earnings are the most important long-term driver of stock prices.
Reviewing the macro crosscurrents
There were a few notable data points and macroeconomic developments from last week to consider:
Powell remains hawkish. During a conversation at the Economic Club of New York, Federal Reserve Chair Jerome Powell reiterated the central bank’s commitment to getting inflation down, specifying that the central bank would be “proceeding carefully.”
From Powell’s prepared remarks: “…inflation is still too high, and a few months of good data are only the beginning of what it will take to build confidence that inflation is moving down sustainably toward our goal. … Given the uncertainties and risks, and how far we have come, the Committee is proceeding carefully. We will make decisions about the extent of additional policy firming and how long policy will remain restrictive based on the totality of the incoming data, the evolving outlook, and the balance of risks.”
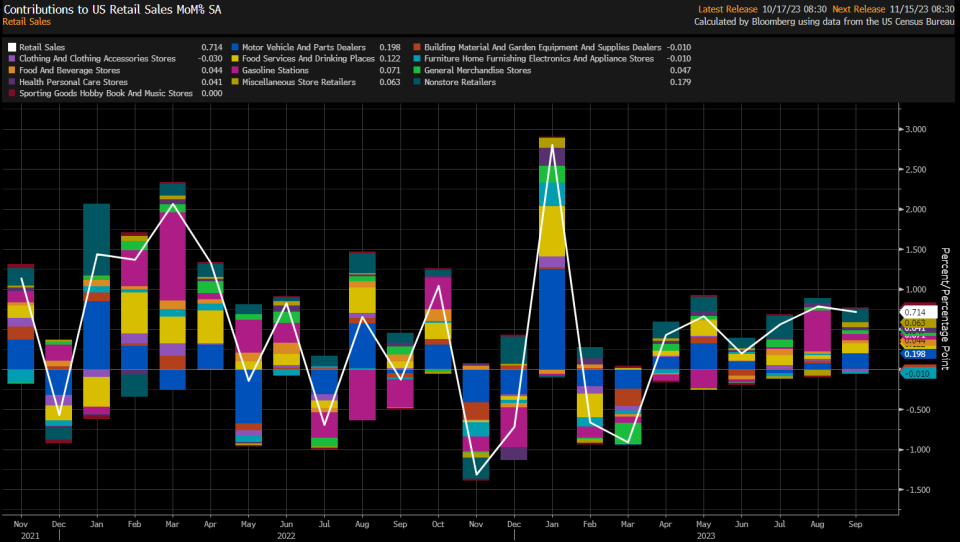
Consumers are spending. According to Census Bureau data released Thursday, retail sales in September increased by 0.7% to a record $704.9 billion.
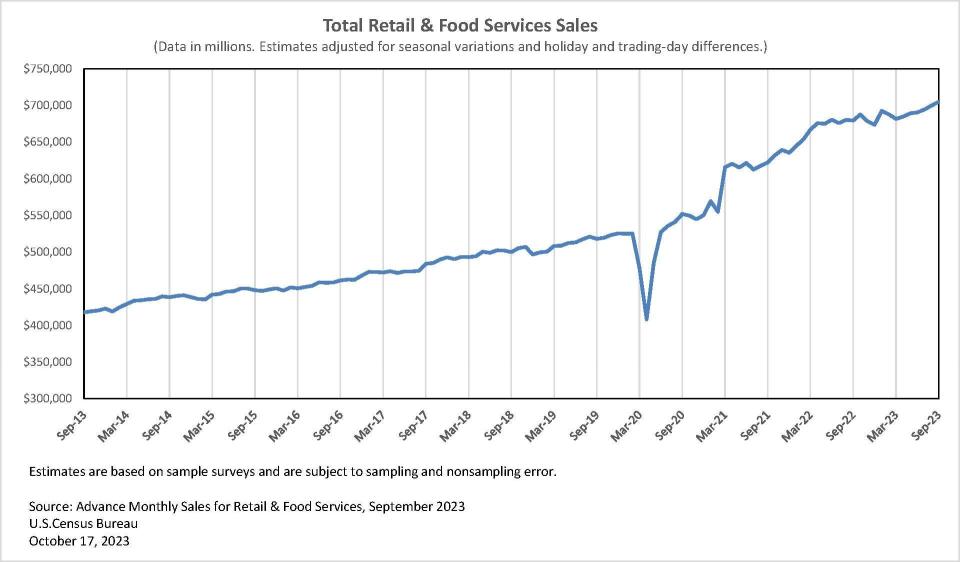
Most retail categories grew, including cars and car parts, restaurants and bars, health and personal care, grocery, and online.
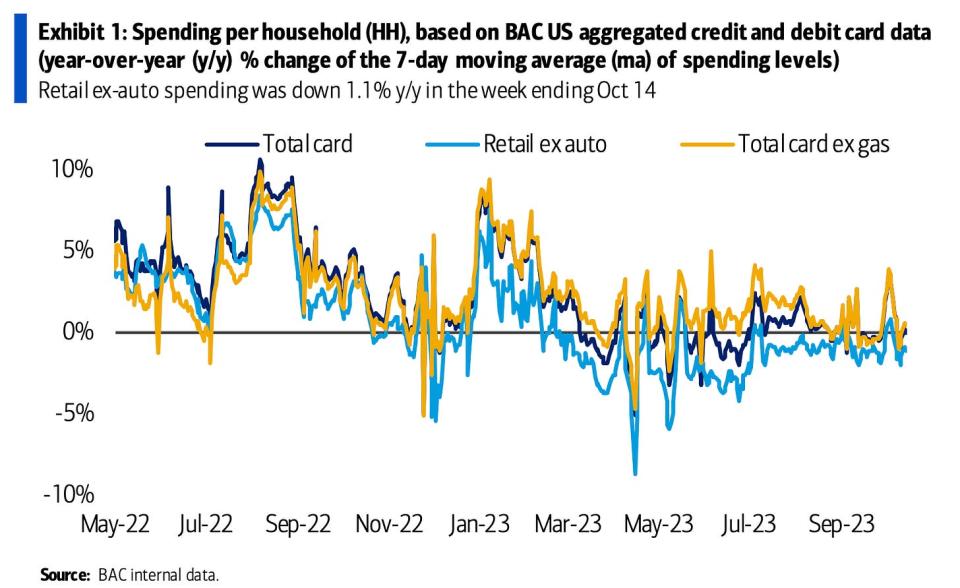
Spending is holding up, according to credit card data. From BofA: “Y/y total card spending per HH came in flat in the week ending Oct 14 according to BAC aggregated credit and debit card data. Total spending per HH ex gas increased 0.4% y/y, while retail ex autos was down 1.1% y/y in the week ending Oct 14.”
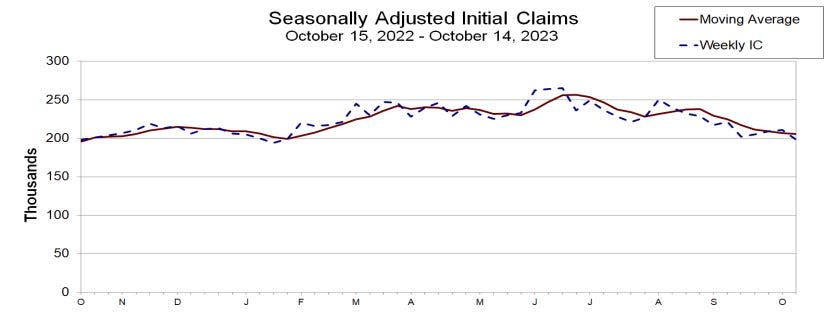
Unemployment claims fall. Initial claims for unemployment benefits fell to 198,000 during the week ending October 14, down from 209,000 the week prior. While this is up from a September 2022 low of 182,000, it continues to trend at levels associated with economic growth.
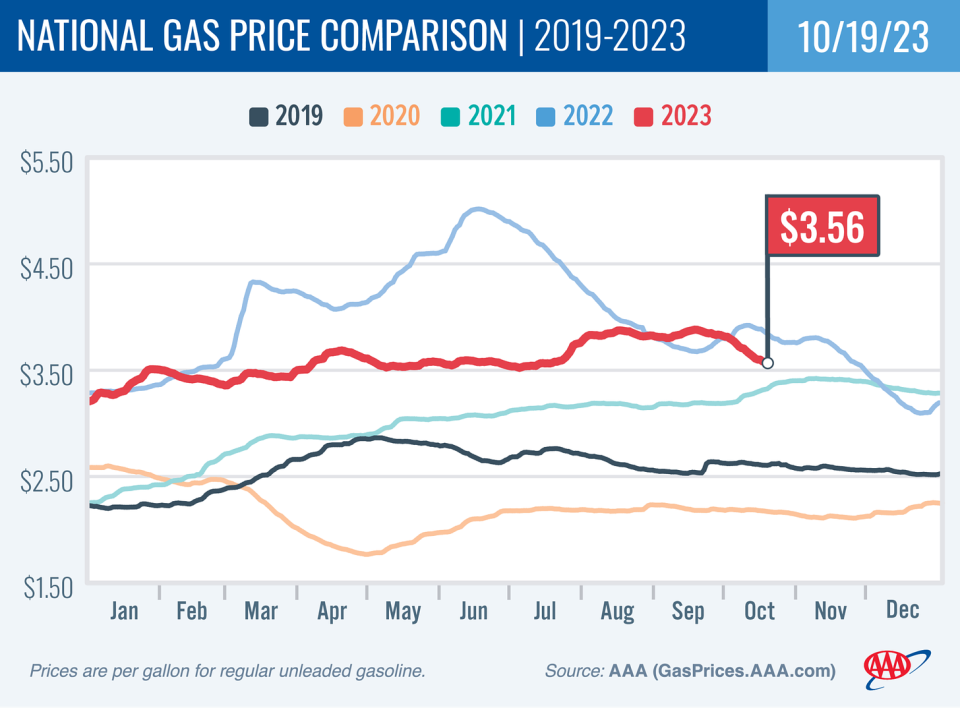
Gas prices fall. From AAA: “Despite global tensions causing ripples through the oil market, the national average for a gallon of gas maintained its autumnal dip, falling eight cents since last week to $3.56. Pump prices have lost 32 cents since their 2023 peak of $3.88 a month ago. This means drivers are saving about $5 every time they fuel up.”
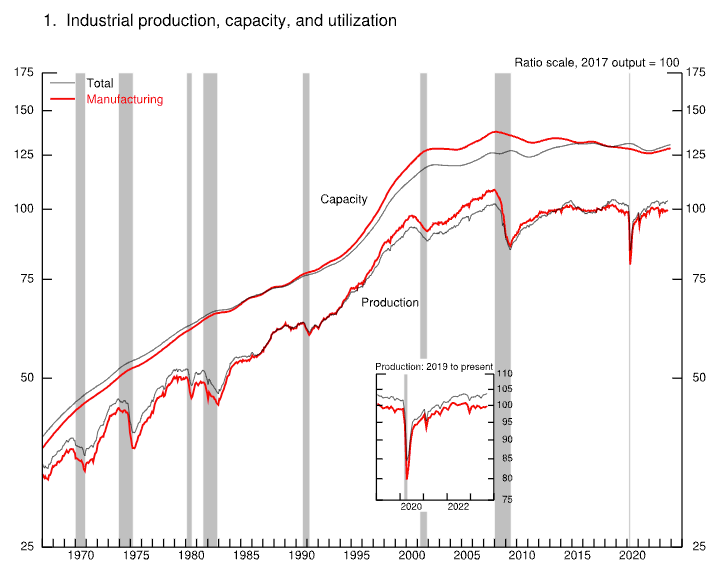
Industrial activity rises. Industrial production activity in September increased 0.3% from August levels, with manufacturing output rising 0.4%.
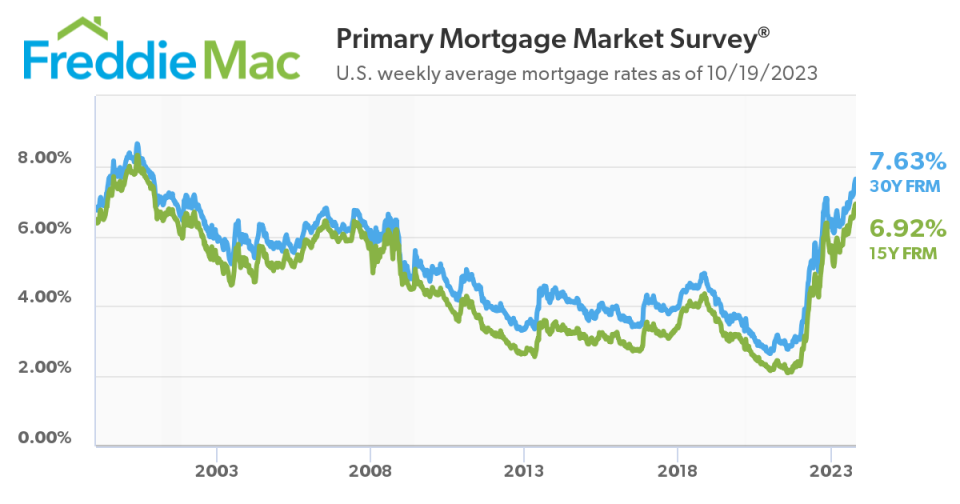
Mortgage rates continue to rise. According to Freddie Mac, the average 30-year fixed-rate mortgage rose to 7.63%, the highest level since December 2000. From Freddie Mac: “Mortgage rates continued to approach eight percent this week, further impacting affordability… Not only are homebuyers feeling the impact of rising rates, but home builders are as well. Incoming data shows that the construction of new homes rebounded in September but as rates keep rising, home builders appear to be losing confidence. As a result, construction could trend down in the short-term.”
Home sales cool. Sales of previously owned homes fell 2.0% in September to an annualized rate of 3.96 million units. From NAR chief economist Lawrence Yun: “As has been the case throughout this year, limited inventory and low housing affordability continue to hamper home sales. … The Federal Reserve simply cannot keep raising interest rates in light of softening inflation and weakening job gains.”

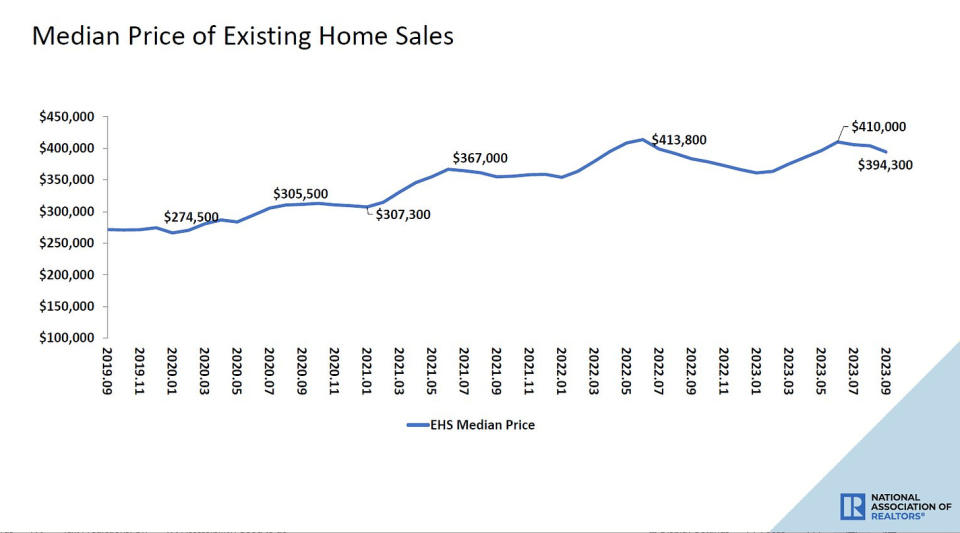
Home prices ticked lower. Prices for previously owned homes fell month over month but were up from year ago levels. From the NAR: “The median existing-home price for all housing types in September was $394,300, an increase of 2.8% from September 2022 ($383,500). All four U.S. regions posted price increases.”
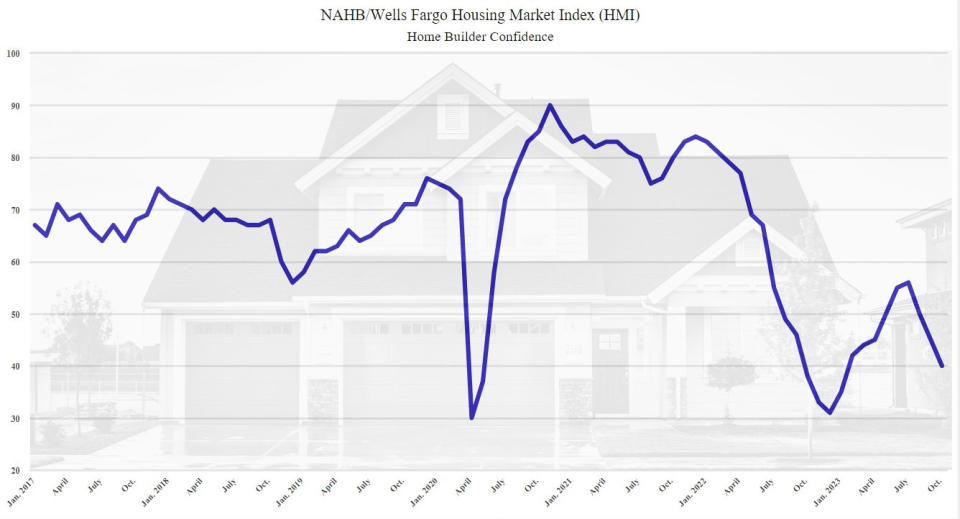
Home builder sentiment is in the dumps. From the NAHB: “Stubbornly high mortgage rates that have climbed to a 23-year high and have remained above 7% for the past two months continue to take a heavy toll on builder confidence, as sentiment levels have dropped to the lowest point since January 2023… As a result of the extended high interest environment, many builders continue to reduce home prices to boost sales. In October, 32% of builders reported cutting home prices, unchanged from the previous month but still the highest rate since December 2022 (35%). The average price discount remains at 6%. Meanwhile, 62% of builders provided sales incentives of all forms in October, up from 59% in September and tied with the previous high for this cycle set in December 2022.”
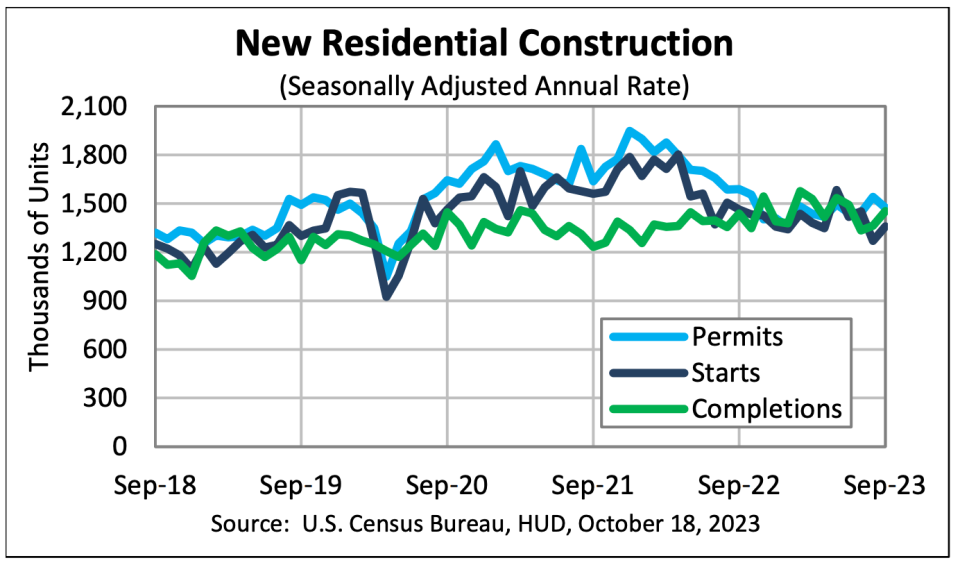
New home construction ticks up. Housing starts rose 7.0% in September to an annualized rate of 1.36 million units, according to the Census Bureau. Building permits fell 4.4% to an annualized rate of 1.47 million units.
The pros are worried about stuff. According to BofA’s October Global Fund Manager Survey, fund managers identified high inflation keeping central banks hawkish as the “biggest tail risk.”

The truth is we’re always worried about something. That’s just the nature of investing.
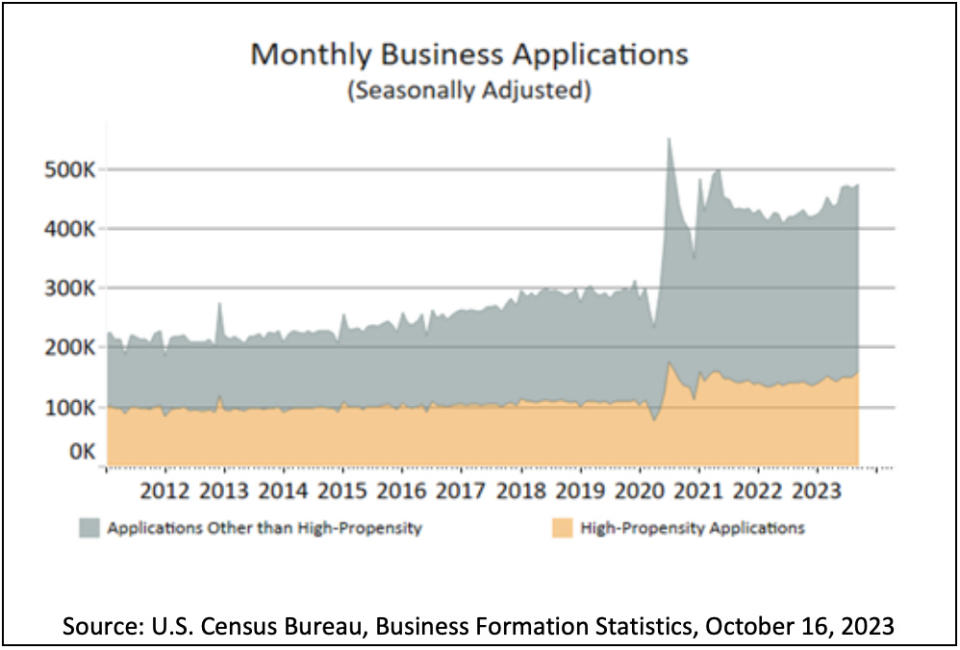
The entrepreneurial spirit is alive. From the Census Bureau: “September 2023 Business Applications were 472,961, up 1.3% (seasonally adjusted) from August. Of those, 159,105 were High-Propensity Business Applications.”
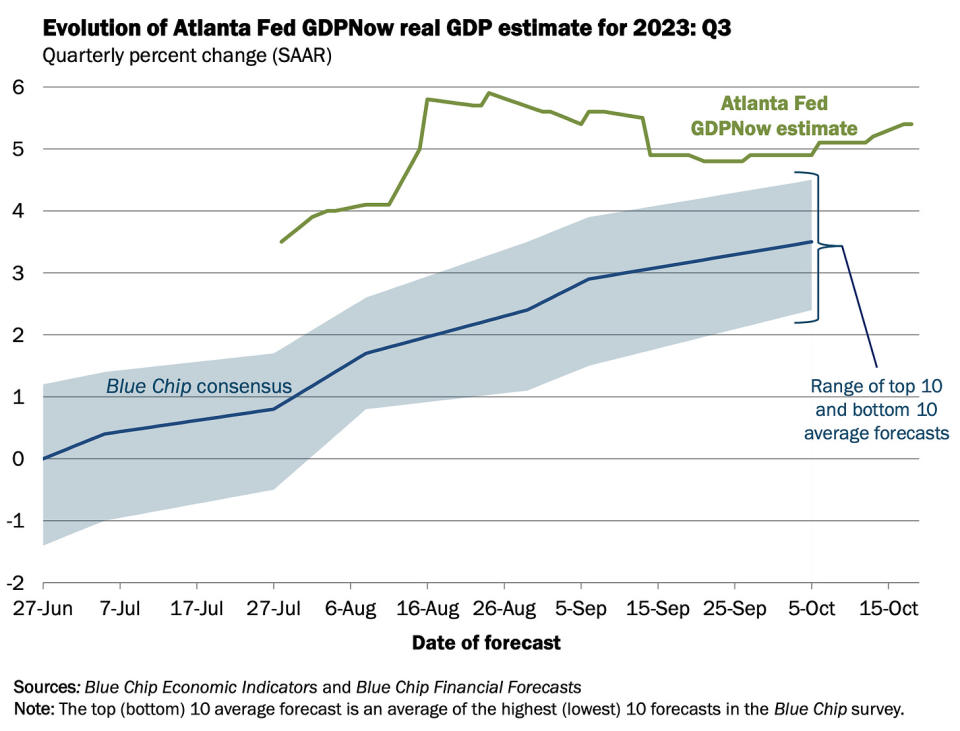
Near-term GDP growth estimates remain positive. The Atlanta Fed’s GDPNow model sees real GDP growth climbing at a 5.4% rate in Q3.
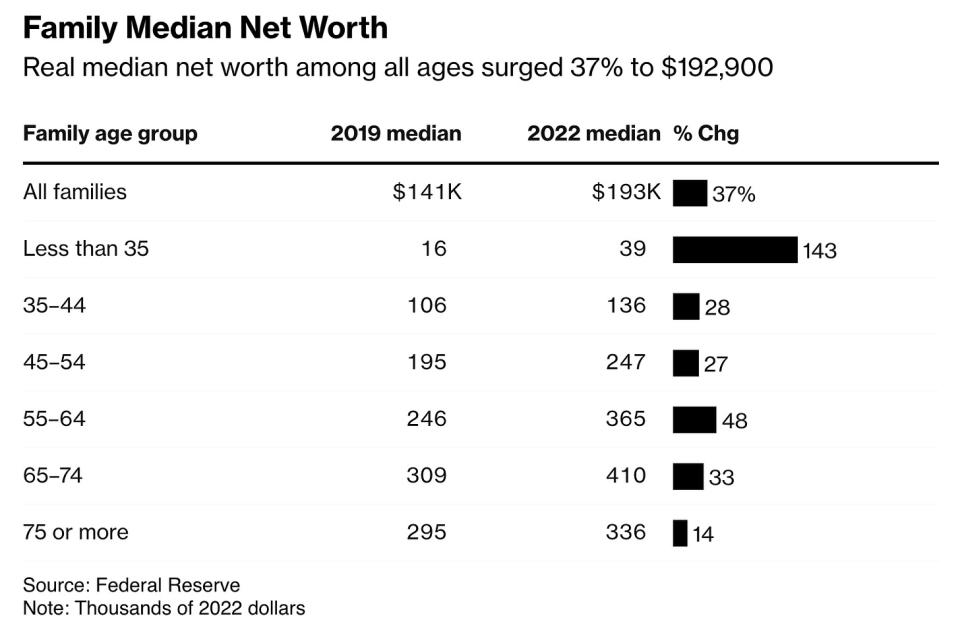
Household net worth booms. From Bloomberg: “Inflation-adjusted median net worth jumped 37% to $192,900 from 2019 to 2022, according to the Federal Reserve’s Survey of Consumer Finances out Wednesday. That marked the largest three-year increase in data back to 1989, and it was more than double the next-largest one on record, the Fed said.”
Putting it all together
We continue to get evidence that we could see a bullish “Goldilocks” soft landing scenario where inflation cools to manageable levels without the economy having to sink into recession.
This comes as the Federal Reserve continues to employ very tight monetary policy in its ongoing effort to bring inflation down. While it’s true that the Fed has taken a less hawkish tone in 2023 than in 2022, and that most economists agree that the final interest rate hike of the cycle has either already happened or is near, inflation still has to cool more and stay cool for a little while before the central bank is comfortable with price stability.
So we should expect the central bank to keep monetary policy tight, which means we should be prepared for tight financial conditions (e.g., higher interest rates, tighter lending standards, and lower stock valuations) to linger. All this means monetary policy will be unfriendly to markets for the time being, and the risk the economy slips into a recession will be relatively elevated.
At the same time, we also know that stocks are discounting mechanisms — meaning that prices will have bottomed before the Fed signals a major dovish turn in monetary policy.
Also, it’s important to remember that while recession risks may be elevated, consumers are coming from a very strong financial position. Unemployed people are getting jobs, and those with jobs are getting raises.
Similarly, business finances are healthy as many corporations locked in low interest rates on their debt in recent years. Even as the threat of higher debt servicing costs looms, elevated profit margins give corporations room to absorb higher costs.
At this point, any downturn is unlikely to turn into economic calamity given that the financial health of consumers and businesses remains very strong.
And as always, long-term investors should remember that recessions and bear markets are just part of the deal when you enter the stock market with the aim of generating long-term returns. While markets have had a pretty rough couple of years, the long-run outlook for stocks remains positive.
Note: A version of this article was published on TKer.co.
Credit: Source link


