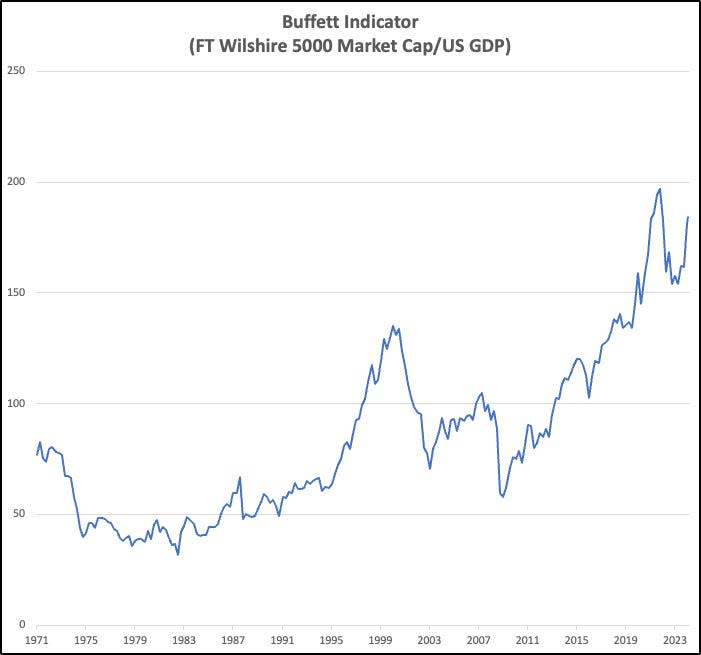
Warren Buffett’s go-to market gauge surged to a two-year high of 184%.
The “Buffett Indicator” compares the stock market’s total value to the overall size of the economy.
Buffett has warned that buying stocks at a reading near 200% is “playing with fire.”
Warren Buffett’s favorite market gauge has surged to a two-year high of 184%, signaling stocks are overvalued and could suffer a devastating crash.
The “Buffett Indicator” takes the combined market capitalization of all actively traded US stocks and divides that figure by the latest quarterly estimate for gross domestic product (GDP). Investors use it to compare the overall value of the stock market to the size of the national economy.
The FT Wilshire 5000 index has jumped 9% to a record high this year, boosting its market capitalization to about $51.47 trillion, according to Wilshire Indexes.
US GDP is up 40% from its pandemic low to $27.94 trillion last quarter. Dividing the first figure by the second gives a reading of 184%.

Buffett proclaimed in a Fortune article in 2001 that his namesake yardstick was “probably the best single measure of where valuations stand at any given moment.”
Berkshire Hathaway’s CEO said that stocks would likely be fairly valued at a reading of 100%, and they’d be approaching bargain territory at 70% or 80%. But he warned it would be “playing with fire” to buy them near the 200% mark.
The legendary investor added that when the indicator soared to a then-record high during the dot-com bubble, it should have been a “very strong warning signal” that a crash was coming.
Stocks have zoomed to record highs this year, prompting several commentators to ring the bubble alarm.
The furious rally has been fueled by immense excitement around AI-related stocks like Nvidia and Microsoft, and mounting hopes on Wall Street that the Federal Reserve will slash interest rates and the economy will escape a recession this year.
Buffett’s yardstick proved its worth at the start of 2022 when it flashed red by surging past 200%. The S&P 500 and tech-heavy Nasdaq Composite plunged 19% and 33% respectively within the next 12 months.
It’s worth noting the gauge is far from perfect, however. It compares the stock market’s current value to a growth reading for the previous quarter.
It also relies on GDP, which excludes overseas income, whereas US stocks price in the value of companies’ domestic and international operations.
Yet the metric’s return to the lofty levels that preceded past market disasters is a clear red flag for some experts.
Both John Hussman, president of Hussman Investment Trust, and Paul Dietrich, B. Riley Wealth Management’s chief investment strategist, have pointed to the indicator’s surge as evidence of a bubble that might end with a painful pop.
Read the original article on Business Insider
Credit: Source link


