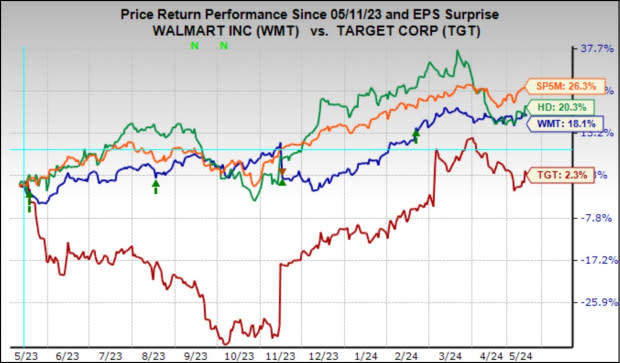
Walmart WMT shares held their own in last month’s market weakness, cementing its anchoring and defensive positioning, particularly relative to Target TGT and Home Depot HD.
From the market’s March 28th peak through the end of April 2024, the S&P 500 index lost -3.8% of its value, while Walmart was down only -1.4%. Target lost -9.2% of its value during that same period, while Home Depot shares were down -12.9%.
Walmart’s defensive attributes reflect the retailer’s heavy grocery exposure and reputation for value. Walmart’s value orientation and well-executed digital strategy have been key to gaining grocery market share by attracting higher-income households.
Walmart’s growing share of higher-income grocery spending notwithstanding, the retailer still has a substantial exposure to lower-income consumers, who appear to be under increasing stress, as reflected in rising loan delinquency rates and other measures indicating strained financial health. This exposure could be a source of vulnerability for Walmart’s same-store sales in its quarterly release on Thursday, May 16th; Target reports the following week on May 22nd.
Walmart is expected to report $0.52 in EPS on $159.2 billion in revenues, representing year-over-year changes of +6.1% and +4.5%, respectively. Trends in Walmart’s non-grocery business have been anemic lately, so any favorable turn in the demand trends for this relatively discretionary merchandise will be a nice offset to the aforementioned lower-income vulnerability. Any signs of life on the discretionary merchandise part will also have positive read-throughs for Target and Home Depot. Home Depot reports on Tuesday, May 14th.
The chart below shows the one-year performance of Walmart, Home Depot, and Target relative to the S&P 500 index.
Image Source: Zacks Investment Research
Target shares were up big following each of the preceding two reports, which assured investors about management’s ability on the margins and the ‘shrinkage issue’ they appeared to be struggling with over the last couple of years. Home Depot is a housing play and, as such, remains exposed to the seemingly higher-for-longer interest rate backdrop.
With respect to the Retail sector 2024 Q1 earnings season scorecard, we now have results from 21 of the 34 retailers in the S&P 500 index. Regular readers know that Zacks has a dedicated stand-alone economic sector for the retail space, unlike the placement of the space in the Consumer Staples and Consumer Discretionary sectors in the Standard & Poor’s standard industry classification.
The Zacks Retail sector includes not only Walmart, Target, and other traditional retailers but also online vendors like Amazon AMZN and restaurant players. The 21 Zacks Retail companies in the S&P 500 index that have reported Q1 results already belong to the e-commerce and restaurant industries.
Total Q1 earnings for these 21 retailers that have reported are up +54.5% from the same period last year on +7.4% higher revenues, with 66.7% beating EPS estimates and 57.1% beating revenue estimates.
The comparison charts below put the Q1 beats percentages for these retailers in a historical context.

Image Source: Zacks Investment Research
As you can see above, the online players and restaurant operators have struggled to exceed EPS and revenue estimates in Q1. In fact, Q1 EPS and revenue beats percentages for these players remain below the average for this group of companies over the preceding 20 quarters (5 years) and are towards the lower end of the 5-year high-low range.
With respect to the earnings and revenue growth rates, we like to show the group’s performance with and without Amazon, whose results are among the 21 companies that have already reported. As we know, Amazon’s Q1 earnings were up +278.7% on +12.5% higher revenues, beating top- and bottom-line expectations.
As we all know, digital and brick-and-mortar operators have been converging for some time now, with Amazon now a decent-sized brick-and-mortar operator after Whole Foods and Walmart a growing online vendor. This long-standing trend got a huge boost from the Covid lockdowns.
The two comparison charts below show the Q1 earnings and revenue growth relative to other recent periods, both with Amazon’s results (left side chart) and without Amazon’s numbers (right side chart).

Image Source: Zacks Investment Research
As noted earlier, we have started seeing signs of stress at the lower end of income distribution, and one can intuitively project moderation in consumer spending as the economy further slows down under the weight of tighter monetary conditions. Inflation may be down from the multi-decade highs of a few quarters back, but it still remains a headwind, particularly for the lower end of income distribution. That said, the labor market remains very strong, with wages still going up.
We will hear more about issues on the Q1 earnings calls, likely in the context of their outlooks for the coming periods.
Earnings Season Scorecard and This Week’s Earnings Reports
The bulk of the Q1 earnings season is now behind us, with results from 460 S&P 500 companies already out through Friday, May 10th. We have almost 400 companies reporting results this week, including 7 S&P 500 members. In addition to Walmart and Home Depot, this week’s line-up includes Cisco Systems, Deere & Company, China’s Alibaba, JD.com, and many others.
Total Q1 earnings for these 460 index members are up +4.8% from the same period last year on +4.2% higher revenues, with 77.4% beating EPS estimates and 60% beating revenue estimates.
The comparison charts below put the Q1 earnings and revenue growth rates in a historical context.

Image Source: Zacks Investment Research
Earnings growth for these companies would have been +7.9% instead of +4.8% had it not been for the substantial Energy sector drag. The chart below puts the Q1 ex-Energy earnings growth pace in the context of other recent quarters.
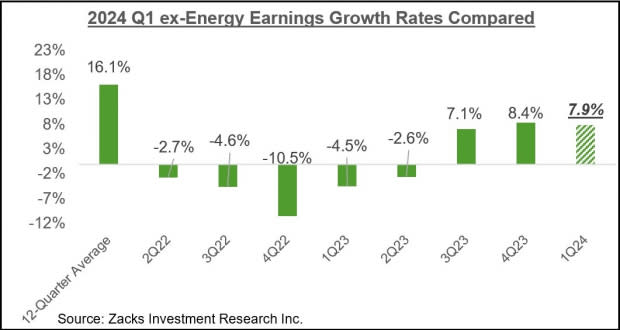
Image Source: Zacks Investment Research
The comparison charts below put the Q1 EPS and revenue beats percentages in a historical context.

Image Source: Zacks Investment Research
As we noted in the context of the Retail sector, beats percentages have been on the weaker side for the index as a whole, with the variance relative to other recent periods particularly notable on the revenues side.
The Earnings Big Picture
Looking at Q1 as a whole, total S&P 500 earnings are expected to be up +6% from the same period last year on +4.2% higher revenues, which would follow the +6.8% earnings growth on +3.9% revenue gains in the preceding period.
The chart below shows current earnings and revenue growth expectations for 2024 Q1 in the context of where growth has been over the preceding four quarters and what is currently expected for the following three quarters.
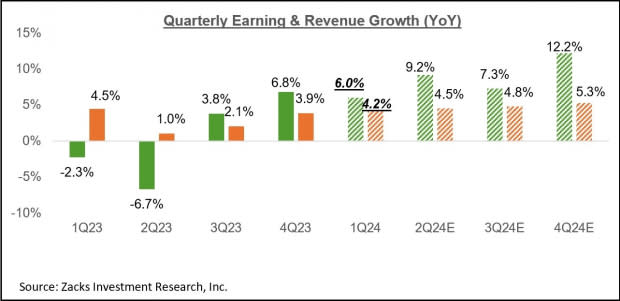
Image Source: Zacks Investment Research
As you likely know already, the Tech and Energy sectors are having the opposite effects on the aggregate growth picture. Excluding the Tech sector, Q1 earnings for the rest of the index would be down -1%, while the growth pace improves to +8.9% on an ex-energy basis.
For the current period (2024 Q2), total S&P 500 earnings are currently expected to be up +9.2% on +4.5% higher revenues.
The revisions trend has been very favorable for Q2 estimates, as the chart below shows.
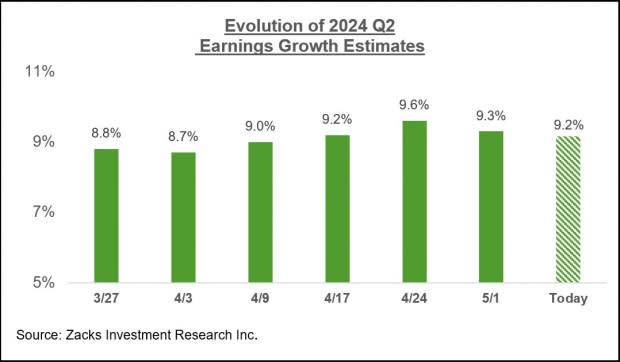
Image Source: Zacks Investment Research
Here is the Q2 revisions trend on an ex-Energy basis
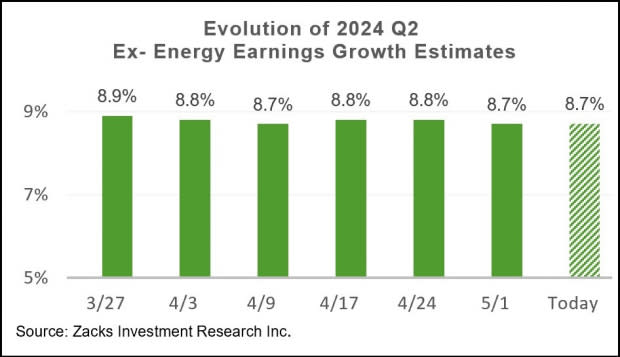
Image Source: Zacks Investment Research
Looking at the overall earnings picture on an annual basis, total 2024 S&P 500 earnings are expected to be up +9% on +1.5% revenue growth.
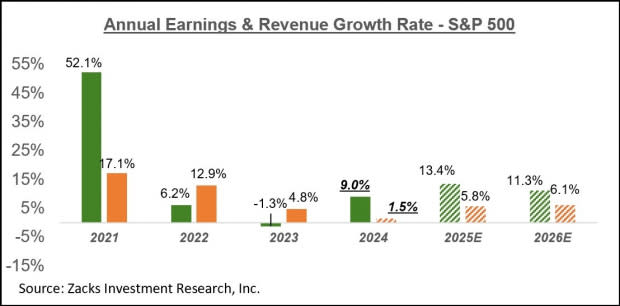
Image Source: Zacks Investment Research
For a detailed look at the overall earnings picture, including expectations for the coming periods, please check out our weekly Earnings Trends report >>>> Earnings Growth Poised to Accelerate
Want the latest recommendations from Zacks Investment Research? Today, you can download 7 Best Stocks for the Next 30 Days. Click to get this free report
Amazon.com, Inc. (AMZN) : Free Stock Analysis Report
Target Corporation (TGT) : Free Stock Analysis Report
Walmart Inc. (WMT) : Free Stock Analysis Report
The Home Depot, Inc. (HD) : Free Stock Analysis Report
To read this article on Zacks.com click here.
Zacks Investment Research
Credit: Source link


