Disclaimer: The opinions expressed by our writers are their own and do not represent the views of U.Today. The financial and market information provided on U.Today is intended for informational purposes only. U.Today is not liable for any financial losses incurred while trading cryptocurrencies. Conduct your own research by contacting financial experts before making any investment decisions. We believe that all content is accurate as of the date of publication, but certain offers mentioned may no longer be available.
As digital assets markets are gearing for a recovery from the severe Crypto Winter, traders are looking for reliable and newbie-friendly price prediction models for major assets. Bitcoin Rainbow Chart by CoinCodex is definitely among the most interesting models to look at.
Introducing Bitcoin Rainbow Chart by CoinCodex: How to use it?
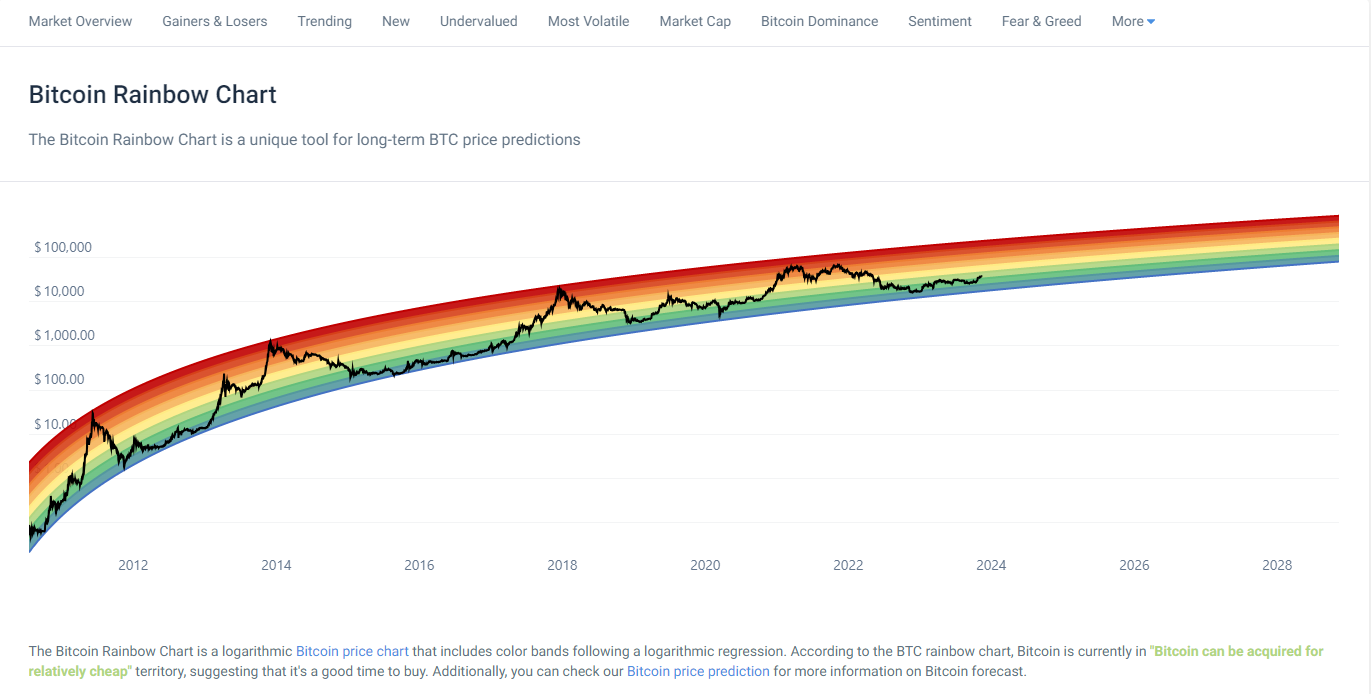
The Bitcoin Rainbow Chart by reputable cryptocurrency data provider CoinCodex is a logarithmic Bitcoin (BTC) price chart that includes color bands following a logarithmic regression. Bitcoin (BTC) price dynamics are demonstrated on the logarithmic scale. CoinCodex tracks the BTC price from mid-2010, so it is the longest-running Bitcoin (BTC) performance model. As a public chart, the model was invented in 2014 by a pseudonymous user of the BitcoinTalk forum.

Simply put, the Bitcoin Rainbow Chart model is based on the assumption that at every moment, Bitcoin (BTC) is either undervalued or overvalued. Model creators demonstrate seven categories of Bitcoin (BTC) price “status”: “Basically a Fire Sale,” “Buy,” “Accumulate,” “Still Cheap,” “HODL,” “Is This a Bubble?” “FOMO Intensifies,” “Sell, Seriously Sell” and “Maximum Bubble Territory.”
These categories — from most undervalued to most overvalued — are associated with different colors of the spectrum. The Bitcoin log chart is used instead of a linear chart in order to better visualize Bitcoin’s long-term growth trajectory. The colder colors indicate a good buying opportunity, while hotter colors indicate a good selling opportunity.
CoinCodex supports traders with reliable data on crypto
“Maximum Bubble Zone” was registered three times in Bitcoin’s (BTC) history: in 2011, 2013 and 2017. In March 2020, Bitcoin (BTC) dropped to “Basically a Fire Sale” for the last time.
In order to predict the Bitcoin (BTC) price for a specific moment in the future, we need to move across the rainbow. In general, the Bitcoin Rainbow Chart looks bullish: for instance, it finds an upper price level for BTC in April 2025 of $354,784 and a lower bound of $27,954, with an average Bitcoin price across the nine bands of $136,566.
Bitcoin Rainbow Chart is available to all users of CoinCodex, a reliable tracker of critical cryptocurrency data. In the form of a user-friendly dashboard, it demonstrates critical economic indicators for Bitcoin (BTC) and major altcoins (price, change, market cap, trading volume, performance in recent periods and so on).
In the “HotSpot” menu, traders can see the best and worst performers of the last day, week and month. Visitors can create customized portfolios and advance their understanding of crypto markets by reading reviews and manuals. The tracker of token sales and initial exchange offerings unlocks many investing opportunities for short-term investors and crypto enthusiasts.
U.Today content on crypto and blockchain now broadcast by CoinCodex
In the “News” module, traders can read about the latest developments of the Web3, crypto and blockchain segments. Starting from Q4, 2023, U.Today content will also be displayed on CoinCodex via its automatic broadcasting instruments.
U.Today is one of the most popular and highly reputable websites on crypto, blockchain, AI and other new-gen tech developments. Visitors of its partners will be able to read news articles, product reviews, market digests, price predictions, manuals and walk-throughs.
Also, crypto enthusiasts can read opinions by the most experienced analysts at U.Today, guides for newbies, partner materials and so on. An “Airdrop Tracker” is the latest addition to U.Today’s portal tooling.
Credit: Source link


