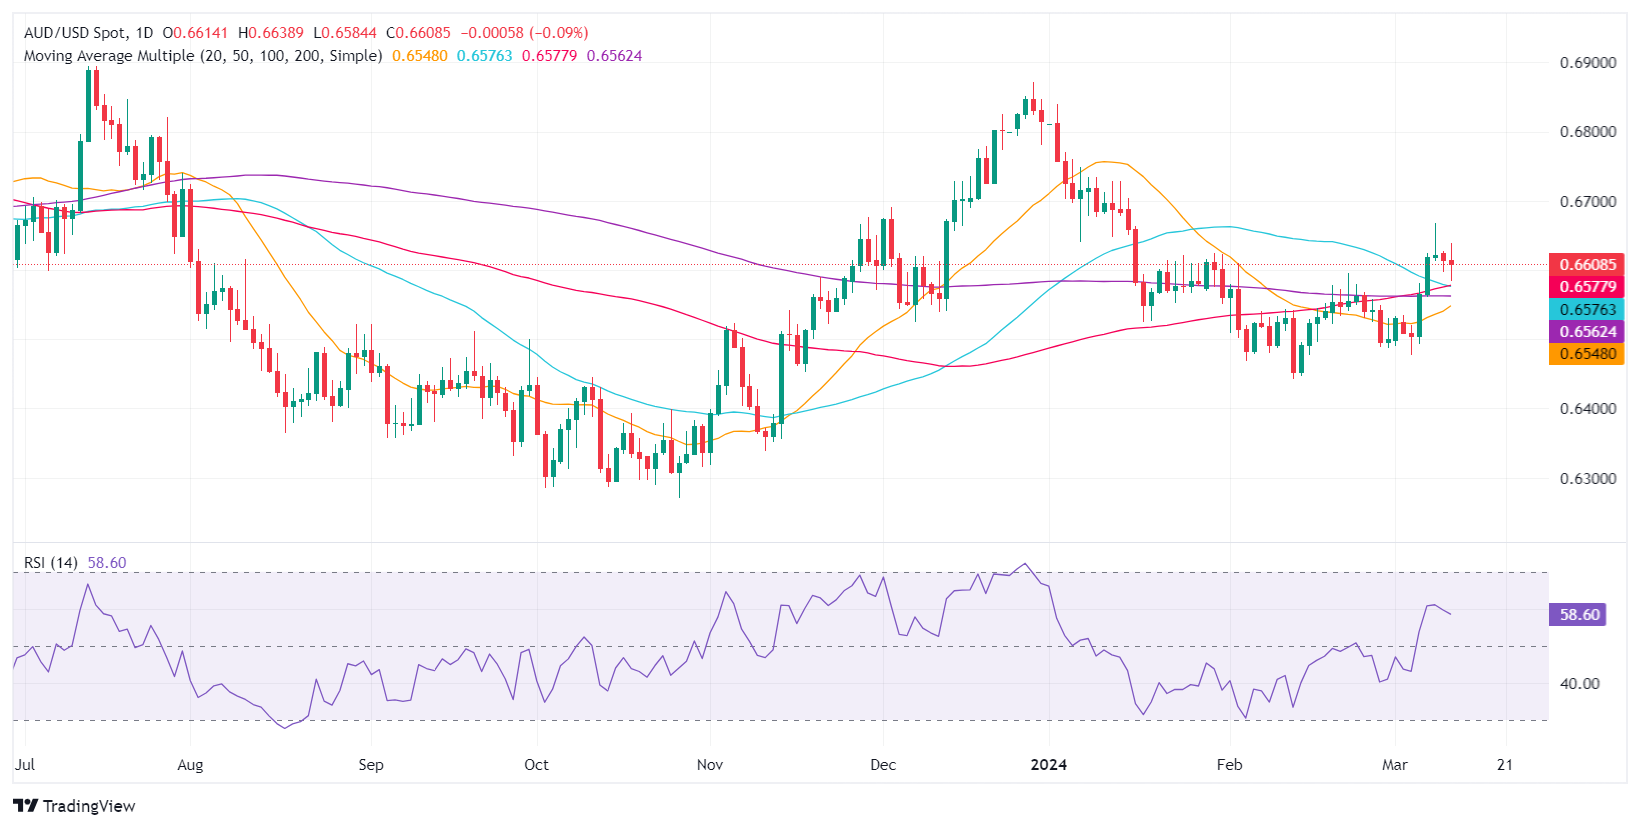
- AUD/USD trends lower after US inflation data prompts rethink on Federal Reserve’s easing timeline.
- February’s CPI report at 3.2% YoY fuels US Dollar strength, overshadowing Australian business sentiment.
- Traders recalibrate rate cut expectations, with focus shifting to upcoming US retail sales data for further cues.
The Australian Dollar printed back-to-back negative days during the week against the US Dollar, courtesy of a warm inflation report in the United States (US) that justified the Federal Reserve’s stance to be patient in cutting borrowing costs. On Tuesday, the AUD/USD was down 0.11%, and as the Wednesday Asian session commences, it trades virtually unchanged at 0.6606.
Aussie Dollar on the defensive as US CPI surpasses forecasts, Fed rate cut estimates adjust
The US Bureau of Labor Statistics (BLS) revealed that February’s inflation was slightly higher than expected. The Consumer Price Index (CPI) in February exceeded estimates of 3.1% YoY as inflation printed 3.2% and above January’s 3.1%. Underlying inflation, as measured by the core CPI, stood at 3.8% YoY, down from 3.9%, but missed the consensus of 3.7%.
After the data, the AUD/USD extended its losses as US Treasury bond yields rose, underpinning the Greenback. The US Dollar Index (DXY), a gauge of the buck’s value against a basket of peers, gained 0.18%, up at 102.92, with buyers shy of reclaiming the 103.00 mark.
Following the US data release, the CME FedWatch Tool shows traders increased their bets for a 25-basis-point rate cut in June, down from 72% a day ago to 68%.
The Aussie’s economic docket on Tuesday featured NAB Business Conditions for February. Conditions improved from 6.0 to 10.0, while Business Confidence deteriorated from 1.0 to 0.0.
Ahead of the week, the Australian economic docket is empty, while in the US, it is not. US Retail Sales for February are expected to rise by 0.8% MoM, and the control group (used to calculate the Gross Domestic Product) at 0.4% MoM
AUD/USD Price Analysis: Technical outlook
The AUD/USD registered two straight sessions with lower closes, suggesting that sellers gathered momentum, but the Relative Strength Index (RSI) indicator shows another story. As the pair extended its losses, the RSI is flat, while the 100-day moving average (DMA) crossed four days ago above the 200-DMA.
That said, the DMAs are in perfectly bullish order, which could signal that buyers are in charge. Nevertheless, they must reclaim the March 12 high at 0.6638 so they can challenge the March 8 cycle high at 0.6667. Further upside is seen at 0.6700. On the other hand, if sellers drag the AUD/USD below 0.6600, further downside is seen, with the confluence of the 50 and the 100-DMA at 0.6573/75 seen as first support, followed by the 200-DMA at 0.6560.
Australian Dollar FAQs
One of the most significant factors for the Australian Dollar (AUD) is the level of interest rates set by the Reserve Bank of Australia (RBA). Because Australia is a resource-rich country another key driver is the price of its biggest export, Iron Ore. The health of the Chinese economy, its largest trading partner, is a factor, as well as inflation in Australia, its growth rate and Trade Balance. Market sentiment – whether investors are taking on more risky assets (risk-on) or seeking safe-havens (risk-off) – is also a factor, with risk-on positive for AUD.
The Reserve Bank of Australia (RBA) influences the Australian Dollar (AUD) by setting the level of interest rates that Australian banks can lend to each other. This influences the level of interest rates in the economy as a whole. The main goal of the RBA is to maintain a stable inflation rate of 2-3% by adjusting interest rates up or down. Relatively high interest rates compared to other major central banks support the AUD, and the opposite for relatively low. The RBA can also use quantitative easing and tightening to influence credit conditions, with the former AUD-negative and the latter AUD-positive.
China is Australia’s largest trading partner so the health of the Chinese economy is a major influence on the value of the Australian Dollar (AUD). When the Chinese economy is doing well it purchases more raw materials, goods and services from Australia, lifting demand for the AUD, and pushing up its value. The opposite is the case when the Chinese economy is not growing as fast as expected. Positive or negative surprises in Chinese growth data, therefore, often have a direct impact on the Australian Dollar and its pairs.
Iron Ore is Australia’s largest export, accounting for $118 billion a year according to data from 2021, with China as its primary destination. The price of Iron Ore, therefore, can be a driver of the Australian Dollar. Generally, if the price of Iron Ore rises, AUD also goes up, as aggregate demand for the currency increases. The opposite is the case if the price of Iron Ore falls. Higher Iron Ore prices also tend to result in a greater likelihood of a positive Trade Balance for Australia, which is also positive of the AUD.
The Trade Balance, which is the difference between what a country earns from its exports versus what it pays for its imports, is another factor that can influence the value of the Australian Dollar. If Australia produces highly sought after exports, then its currency will gain in value purely from the surplus demand created from foreign buyers seeking to purchase its exports versus what it spends to purchase imports. Therefore, a positive net Trade Balance strengthens the AUD, with the opposite effect if the Trade Balance is negative.
Credit: Source link


